Create an Effective Software Development Metrics Dashboard

Why Metrics Dashboards Transform Development Teams

Software development is a complex undertaking. With so many moving parts, maintaining visibility and control is paramount. Software development metrics dashboards offer a solution, providing a central hub for monitoring project health. This allows teams to make data-driven decisions, proactively address challenges, and cultivate a culture of continuous improvement.
Benefits of Using Metrics Dashboards
Metrics dashboards go beyond simply tracking numbers. They offer actionable insights that directly influence team performance and project success.
-
Enhanced Visibility: Dashboards offer a clear, real-time snapshot of project progress. This helps identify potential roadblocks early, allowing for timely intervention before small issues become major setbacks.
-
Data-Driven Decisions: Teams can make informed decisions based on concrete data, not just intuition. This results in smarter resource allocation, prioritization, and process improvements.
-
Improved Collaboration: Shared access to metrics fosters transparency and accountability. Everyone on the team has a clear understanding of the project’s status and their role in its success, promoting better communication and collaboration.
-
Increased Efficiency: By identifying bottlenecks and inefficiencies, dashboards enable teams to optimize workflows. This can lead to significant reductions in development time and boost overall productivity.
-
Better Predictability: Tracking metrics over time helps establish baselines and identify trends. This improves project estimation accuracy and predictability, resulting in more reliable delivery timelines.
The Impact of Key Performance Indicators (KPIs)
The real strength of a metrics dashboard lies in the Key Performance Indicators (KPIs) it tracks. These metrics provide quantifiable insights into different aspects of the development process. By 2025, development teams are projected to track at least 15 KPIs on their dashboards.
These will include metrics like development velocity, scope completion ratio, and scope added after sprint. Industry benchmarks show that mature Agile teams typically maintain a development velocity between 20 and 40 story points per sprint, with top performers exceeding 50. High-performing organizations achieve scope completion ratios above 90%, surpassing the average of 70-80%. This detailed tracking empowers managers to visualize progress and identify bottlenecks in real time, improving planning accuracy. Teams using dashboards to monitor velocity and scope completion have reported a 25-30% improvement in sprint predictability and delivery consistency. Learn more about software development metrics
From Data to Actionable Insights
The ultimate value of a software development metrics dashboard lies in its ability to transform raw data into actionable insights. This involves not only collecting data but also interpreting its meaning. By understanding the relationships between various metrics, teams can pinpoint areas for improvement and implement targeted strategies to enhance performance. This continuous cycle of measurement, analysis, and improvement is the key to unlocking a development team's full potential.
Essential Metrics That Actually Drive Engineering Success
Moving beyond superficial metrics, let's explore the meaningful measurements that truly influence software development outcomes. A robust software development metrics dashboard concentrates on key areas like delivery performance, code quality, deployment health, and team dynamics. This provides teams with a comprehensive view of their strengths and weaknesses.
Delivery Performance Metrics
This category focuses on how efficiently your team delivers functional software.
-
Velocity: Measures the amount of work completed during a given sprint or iteration. This helps predict future output and manage expectations.
-
Throughput: Tracks the number of units of work (e.g., features, user stories) delivered over a specific period. This highlights the overall delivery speed.
-
Cycle Time: The time it takes for a task to go from "in progress" to "done." A shorter cycle time often indicates greater efficiency. Check out our guide on How to master cycle time.
Code Quality Metrics
These metrics evaluate the health and maintainability of your codebase.
-
Defect Density: The number of bugs per thousand lines of code (KLOC). A lower defect density suggests higher quality code.
-
Test Coverage: The percentage of your code covered by automated tests. Higher coverage typically leads to fewer bugs in production. Tools like SonarQube can help track and improve test coverage.
-
Code Complexity: Measures how intricate and challenging your code is to understand. Simpler code is easier to maintain and debug.
Deployment Health Metrics
These metrics reflect the stability and reliability of your deployment process.
-
Lead Time: The time it takes from code commit to deployment. A shorter lead time allows for faster feedback and quicker iterations.
-
Deployment Frequency: How often you deploy new code to production. Frequent deployments allow for faster delivery of value to users. Jenkins is a popular tool for automating deployments.
-
Mean Time To Recovery (MTTR): The time it takes to resolve a production incident. A lower MTTR minimizes downtime and user impact.

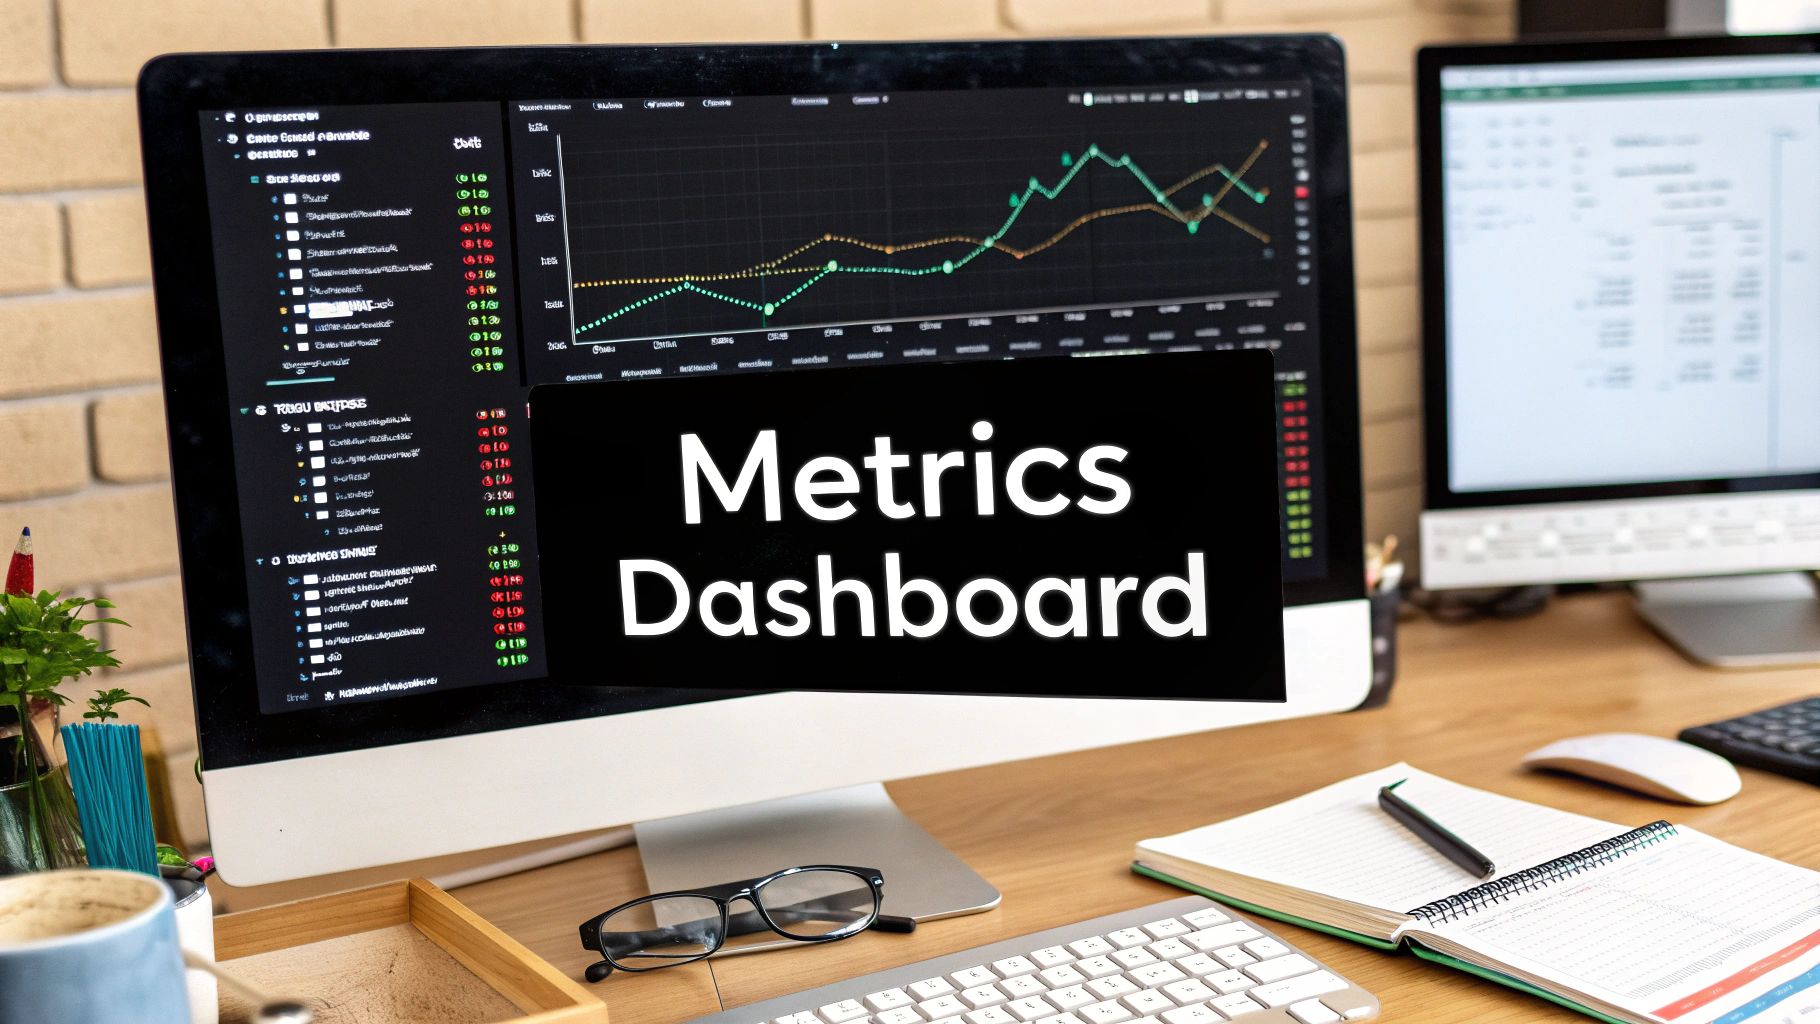
This infographic visualizes core metrics, showing a team member analyzing code metrics and gauges on a monitor. This clear visualization emphasizes the importance of monitoring these key indicators for project success. The image highlights how a well-designed software development metrics dashboard can provide a clear overview of critical project data, enabling faster identification of potential problems.
To further understand the impact of using a software development metrics dashboard, let's look at some key statistics. Organizations leveraging these dashboards often see a significant reduction in defect density, sometimes between 40-60%. Elite teams maintain defect densities below 5 per KLOC, while the average is 10-15 per KLOC. Top-performing teams often achieve 80-95% test coverage, compared to the industry average of 60-70%. These high-performing teams have also decreased their MTTR to under 30 minutes thanks to effective dashboard use. For a more detailed breakdown, check out these resources: Software Development KPIs and How to master software quality metrics.
The following table provides a summary of these essential metrics:
Essential Software Development Metrics by Category
| Metric Category | Key Metrics | What It Measures | Target Values for Elite Teams | |-----------------------|-----------------------------------|------------------------------------------------------|--------------------------------| | Delivery Performance | Velocity, Throughput, Cycle Time | Efficiency of software delivery | Short cycle times, high throughput | | Code Quality | Defect Density, Test Coverage, Code Complexity | Health and maintainability of the codebase | Low defect density, high test coverage | | Deployment Health | Lead Time, Deployment Frequency, MTTR | Stability and reliability of deployments | Short lead times, high frequency, low MTTR | | Team Dynamics | PR Turnaround Time, Collaboration Patterns | Effectiveness of team collaboration and communication | Fast turnaround times, effective collaboration |
This table categorizes key software development metrics, offering insights into what they measure and providing target values for high-performing teams. By focusing on these areas, teams can optimize their performance and deliver high-quality software efficiently.
Team Dynamics Metrics
These metrics measure the effectiveness of team collaboration and communication.
-
Pull Request (PR) Turnaround Time: The time it takes for a pull request to be reviewed and merged. Faster turnaround times contribute to quicker development cycles. GitHub and GitLab are commonly used platforms for managing pull requests.
-
Collaboration Patterns: Analyzing how team members interact on code reviews and other collaborative tasks offers insights into communication effectiveness.
By tracking these key metrics, engineering teams gain valuable insights into their performance and identify areas for improvement. This data-driven approach ultimately results in better software and faster delivery. A comprehensive dashboard, along with the right tools and processes, empowers teams to achieve their goals and deliver exceptional results.
Crafting Dashboards That People Actually Use
A powerful software development metrics dashboard can significantly improve your team's performance, but only if it's actively used. This section explores design principles that transform complex data into intuitive visualizations, encouraging genuine team engagement. Even the most insightful metrics are wasted if they're left unused. Before designing your dashboard, consider which metrics matter most. A great resource for this is the Essential Developer Productivity Metrics guide.
Visualizing Data Effectively
Effective data presentation isn't just about creating charts and graphs; it's about selecting the right visualization for the data.
- Line charts: Perfect for displaying trends over time, such as velocity or cycle time.
- Bar charts: Excellent for comparisons between different data points, like bug counts across modules.
- Pie charts: Useful for visualizing proportions, such as the breakdown of work types.
- Heatmaps: Great for highlighting problem areas, like code complexity or defect density.
Choosing the correct visualization helps teams quickly understand the story behind the data.
Structuring Information for Clarity
Dashboard structure is crucial for usability. Organize information logically and highlight key metrics.
- Prioritize key metrics: Display the most important metrics prominently at the top of the dashboard.
- Use clear labels: Ensure all charts and graphs have clear, descriptive titles and axis labels.
- Group related metrics: Organize metrics into logical groups based on their category (e.g., delivery performance, code quality).
This clear structure allows teams to quickly find the information they need, promoting regular dashboard use.
The Psychology of Color and Thresholds
Color can significantly impact dashboard effectiveness. Think about the psychology of color when designing your dashboard.
- Use color strategically: Use color to highlight important data or indicate thresholds. Green could signify healthy metrics, while red might flag areas needing attention.
- Establish meaningful thresholds: Set clear thresholds that trigger action. For example, a visual alert could be triggered if the cycle time exceeds a defined limit.
These visual cues draw attention to areas needing immediate action, preventing minor issues from becoming major problems.
Mobile-Friendly and Accessible Design
Ensuring your dashboard is accessible from any device is vital.
- Responsive design: Ensure your dashboard adapts to different screen sizes for optimal viewing on any device.
- Simplified interface: Maintain a clean and uncluttered mobile interface, focusing on the most critical metrics.
Accessibility promotes consistent usage, no matter the location or device.
By implementing these design principles, you can transform your software development metrics dashboard from an unused report into a vital tool that drives team performance and project success. A well-designed dashboard encourages regular use, empowering your team to leverage data and achieve their goals.
From Concept to Launch: Building Your Metrics Dashboard

Building a software development metrics dashboard is a process, not an event. This section will guide you through the key steps, from selecting the right tools to ensuring your team adopts the new dashboard. We'll offer practical advice for each stage of the journey.
Selecting the Right Tools and Platform
The platform you choose is the bedrock of your dashboard’s success. Options range from simple spreadsheets to sophisticated, dedicated analytics platforms like Google Analytics or customizable visualization tools like Tableau. Your choice depends on several factors: team size, existing tech stack, budget, and the specific metrics you aim to track. Smaller teams might find a simple spreadsheet or integration with their Jira project management tool sufficient. Larger teams, on the other hand, often benefit from dedicated platforms offering advanced analytics and reporting capabilities. The key is to choose a tool that seamlessly integrates with your existing workflow.
Integrating With Your Development Ecosystem
Integrate your software development metrics dashboard with tools like Git, Jira, and your CI/CD pipeline for a smooth and efficient experience. This integration automates data collection, minimizing manual effort and maximizing data accuracy. Connecting to your Git repository, for example, allows you to automatically track key metrics such as commit frequency and code churn. Integrating with Jira can unlock insights into issue resolution times and sprint velocity. This real-time view of your development process is invaluable for identifying bottlenecks and areas for improvement.
Data Collection Strategies and Accuracy
Reliable data is the foundation of accurate insights. Define clear data sources and establish how each metric will be calculated. For example, precisely define how you'll measure cycle time, a critical metric that tracks the time it takes for a task to move from “in progress” to “done.” This involves clearly identifying the start and end points of the cycle, as well as the different phases involved, like coding, review, and deployment. For a deeper dive into this essential metric, check out this helpful guide: How to Master Cycle Time. Regularly validate your data by cross-checking it against different sources or performing manual audits to maintain accuracy and ensure your decisions are well-informed.
Starting Small and Iterating
Start with a Minimum Viable Dashboard (MVD). Concentrate on a few key metrics that directly address your team’s immediate challenges. This allows you to quickly demonstrate the dashboard's value and gather feedback for improvement. You might begin by tracking velocity and defect density. As you gain experience with these, incorporate additional metrics such as cycle time and test coverage. This iterative process ensures your dashboard evolves to meet your team's specific needs.
By following these steps, you can build a software development metrics dashboard that truly empowers your team and fosters data-driven decision-making. Starting small, integrating effectively, and prioritizing data accuracy sets the stage for long-term success. The ultimate goal isn’t just to build a dashboard, but to create a valuable tool that promotes continuous improvement and drives team performance.
Creating a Culture Where Metrics Drive Collaboration
A software development metrics dashboard, no matter how well-designed, is only as valuable as the team's willingness to use it. This section explores how to cultivate a culture where metrics foster collaboration, not competition, transforming dashboards from potential monitoring tools into catalysts for shared success. The key is addressing the human element, ensuring the focus remains on team improvement, not individual evaluation.
Building Trust and Transparency
Introducing metrics should be a collaborative effort, involving the team from the outset. Discuss which metrics are most relevant to their work and why they’re being tracked. This shared ownership builds trust and ensures everyone understands the dashboard’s purpose. Be transparent about how the data will be used, emphasizing collective improvement, not individual scrutiny. This creates a safe environment for growth. You might be interested in: How to master improving team collaboration.
Shared Ownership and Evolution
Treat the software development metrics dashboard as a living document, constantly evolving. Regularly solicit feedback and involve the team in making adjustments. This reinforces shared ownership and ensures the dashboard stays relevant and useful. For example, teams can discuss visualization effectiveness, new metrics, and improvements to existing ones. This collaborative approach ensures the dashboard remains a valuable team resource.
Metrics as Conversation Starters
Use the dashboard to spark productive conversations, not to deliver judgments. Encourage team members to analyze the data together and identify areas for collective improvement. For instance, if pull request cycle time increases, the team can discuss potential bottlenecks and brainstorm solutions. This transforms the dashboard into a platform for open communication and problem-solving. Read also: How to master improving team collaboration.
Balancing Data with Engineering Judgment
While data is essential, it shouldn’t replace engineering judgment. Encourage teams to use the dashboard as a guide, but also rely on their experience and expertise. This avoids over-reliance on metrics and encourages critical thinking. A high defect density might indicate a need for better testing, but it could also mean the team is tackling complex tasks. This nuanced understanding ensures the dashboard informs decisions, but doesn't dictate them.
The adoption of software development metrics dashboards has significantly impacted team collaboration and morale. Teams actively monitoring metrics like code review participation and pull request merge times have reported a 15-20% increase in developer engagement and satisfaction. By tracking pull requests per developer (averaging 3-5 weekly) and merge times (ideally under 4 hours), teams can quickly address bottlenecks. Visualizing team morale metrics has led to up to a 30% decrease in voluntary developer turnover. This highlights the power of dashboards in fostering transparency and continuous improvement. Explore this topic further: How dashboards drive performance and security.
By focusing on these strategies, organizations can create a culture where metrics empower teams to collaborate effectively, improve processes, and deliver exceptional software. A thoughtful implementation approach transforms the dashboard from a potential source of stress into a powerful tool for shared success.
Next-Generation Dashboard Trends Reshaping Development
The world of software development metrics dashboards is constantly evolving. This exploration dives into the latest trends that leading teams are using to improve their development processes. We'll look at how these changes are impacting current practices and which features your team should consider for its own dashboard.
Predictive Analytics and Forecasting
Progressive organizations are moving beyond simply reflecting past performance and embracing predictive analytics to foresee upcoming challenges. By studying historical data and identifying current trends, these dashboards can project potential delivery risks before they affect the project. This proactive approach helps teams address issues, adjust resources, and minimize delays. For example, a dashboard might predict a bottleneck in testing based on the current rate of bug fixes. For further insights, check out How to master code review best practices.
Machine Learning for Anomaly Detection
Machine learning is being integrated into dashboards to pinpoint unusual patterns in team performance. These algorithms can identify anomalies that might be missed, providing valuable insights into areas needing attention. This could include detecting unexpected drops in productivity, unusual increases in code complexity, or deviations from established coding standards. These insights help teams quickly investigate and address underlying problems.
Connecting Metrics to Business Outcomes
Top teams are looking beyond technical metrics and connecting their software development metrics dashboard directly to business outcomes. By linking development metrics to business goals, teams can clearly show the impact of their work on the organization's success. This could involve correlating deployment frequency with customer acquisition or linking reduced bug counts to higher customer satisfaction. This provides a broader view of the value of development work.
Real-Time Dashboards and Contextual Interfaces
Real-time dashboards are replacing static weekly reports, giving up-to-the-minute information on project status. Furthermore, contextual interfaces tailor dashboard displays based on the user's role. A project manager might see high-level project timeline and budget metrics, while a developer might see code quality and individual task progress. To understand the impact of dashboard changes, consider using solid feedback mechanisms. This personalized approach ensures everyone has the information they need.
Integrating Qualitative and Quantitative Data
Finally, leading organizations understand that a complete view requires more than just numbers. They’re incorporating qualitative signals like team morale and customer feedback along with traditional quantitative metrics. This wider perspective provides a deeper understanding of project health and team dynamics. This could include integrating survey data on developer satisfaction or performing sentiment analysis on customer reviews.
To summarize the key features and benefits discussed, let's look at a comparison of popular dashboard tools:
Introducing the following table, "Comparison of Software Development Metrics Dashboard Tools", which compares popular dashboard solutions across key features, integration capabilities, customization options, and price ranges.
| Tool | Key Features | Integration Capabilities | Customization Level | Price Range | Best For | |---|---|---|---|---|---| | Azure DevOps | Customizable dashboards, work item tracking, CI/CD pipelines, Git integration | Integrates with various Azure services, GitHub, and other tools | Highly customizable with widgets, extensions, and APIs | Free tier available, paid plans based on usage | Teams using Microsoft technologies and seeking a comprehensive DevOps platform | | Jira | Issue tracking, project management, agile boards, reporting | Integrates with Confluence, Bitbucket, and other Atlassian tools, as well as various third-party applications | Customizable workflows, fields, and reports | Free tier available, paid plans based on users and features | Agile teams and organizations managing software projects | | Datadog | Infrastructure monitoring, application performance monitoring, log management, dashboards | Integrates with a wide range of cloud providers, databases, and other monitoring tools | Highly customizable dashboards and alerts | Free trial available, paid plans based on usage | Organizations focusing on monitoring and observability | | Grafana | Open-source dashboarding tool, supports various data sources, alerting | Integrates with Prometheus, Graphite, InfluxDB, and other data sources | Highly customizable dashboards and plugins | Open-source, free to use. Grafana Cloud offers hosted solutions with various pricing tiers. | Teams seeking a flexible and open-source dashboarding solution |
This table highlights the diverse options available for software development metric dashboards. Each tool caters to different needs, from comprehensive DevOps platforms like Azure DevOps to specialized monitoring solutions like Datadog. Choosing the right tool depends on your specific requirements and integration needs.
These advancements in software development metric dashboards empower teams to be more proactive, data-driven, and closely aligned with business objectives. By embracing these trends, your team can unlock the full potential of its software development metrics dashboard to boost efficiency and deliver outstanding results.
Ready to improve your code review process and boost your development metrics? Check out Pull Checklist, a GitHub Marketplace app that automates and enhances code reviews with powerful, condition-based checklists. Learn more about Pull Checklist and optimize your workflow.