Top Software Quality Metrics to Boost Your Code

Unlocking Software Excellence: Measuring What Matters
This listicle presents seven crucial software quality metrics every development team should track. Understanding these metrics provides valuable insights into your codebase's health, enabling proactive issue identification and ensuring project longevity. By tracking metrics like cyclomatic complexity, code coverage, and defect density, you can objectively assess and improve software quality. This list will cover key metrics including Mean Time Between Failures (MTBF), technical debt ratio, code duplication, and maintainability index, offering practical guidance for enhancing your development process. Learn how to build more robust, maintainable, and higher-quality software.
1. Cyclomatic Complexity
Cyclomatic Complexity is a crucial software quality metric that quantifies the complexity of a program by evaluating the number of linearly independent paths through its source code. Developed by Thomas J. McCabe in 1976, it leverages graph theory to analyze a program's control flow graph. Each node in this graph represents a block of code, and edges represent the control flow paths between these blocks. This metric is calculated using the formula M = E - N + 2P, where E represents the number of edges, N represents the number of nodes, and P represents the number of connected components.
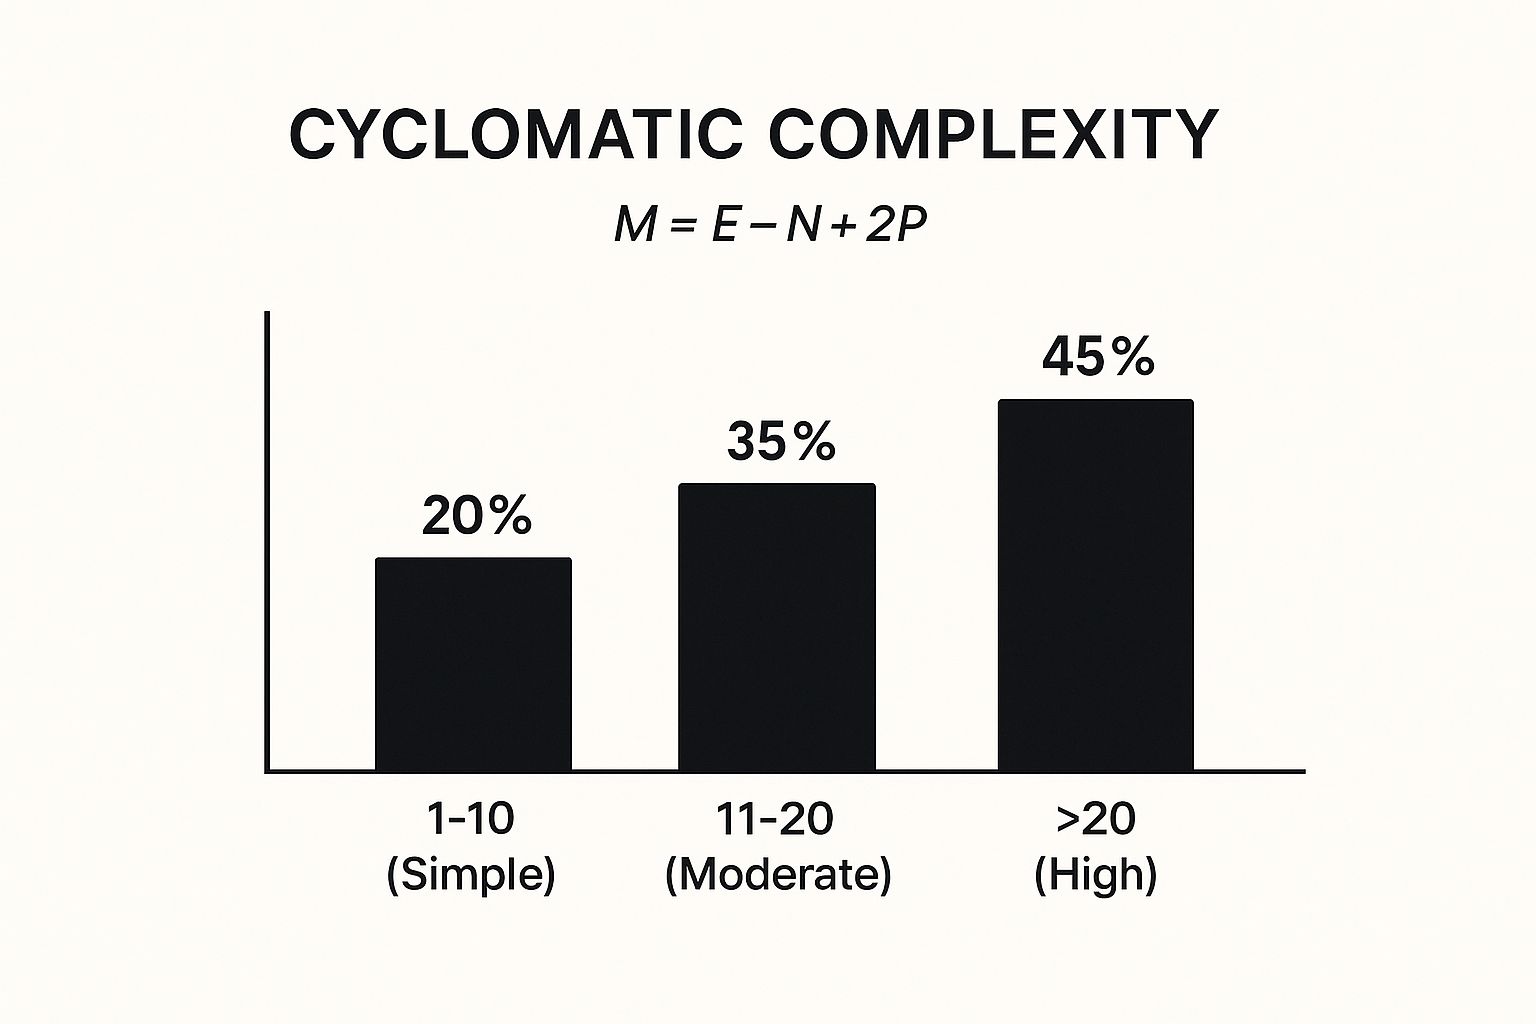
The infographic above visually represents how Cyclomatic Complexity increases with the number of decision points within a code block. The chart clearly demonstrates that a single if statement (Complexity 1) is straightforward, but the complexity ramps up with nested if statements and other control flow mechanisms like else if and switch statements. As the chart depicts, more complex control flow leads to a higher Cyclomatic Complexity score, suggesting increased difficulty in understanding, testing, and maintaining the code.
This metric provides valuable insights into the structural complexity of the code, with generally accepted ranges classifying code complexity: 1-10 (simple), 11-20 (moderate), and 20+ (high). Learn more about Cyclomatic Complexity. This makes Cyclomatic Complexity a powerful tool for software quality assessment, particularly for imperative programming paradigms. Its language-independent nature makes it applicable across diverse programming languages and projects.
Features and Benefits:
- Measures structural complexity: Provides a quantifiable measure of code complexity, facilitating objective comparison and analysis.
- Based on graph theory: Uses a well-established mathematical framework, ensuring a rigorous and consistent approach to complexity measurement.
- Strong indicator of maintainability: High cyclomatic complexity often correlates with code that is difficult to understand, modify, and debug.
- Helps identify refactoring targets: Pinpoints overly complex methods or functions that are prime candidates for refactoring.
- Correlates with defect rates: Studies have shown a positive correlation between high cyclomatic complexity and the likelihood of defects in code.
- Language-independent: Applicable to a wide range of programming languages, making it a versatile metric.
Pros:
- Excellent indicator of code maintainability.
- Helps identify areas for refactoring.
- Correlates well with defect rates.
- Language-independent metric.
Cons:
- Doesn't account for data complexity. A function processing complex data structures might have low cyclomatic complexity but still be challenging to understand.
- May not reflect complexity from complex business logic.
- Could lead to artificial code fragmentation to artificially lower scores.
- Not as effective for functional programming paradigms.
Examples of Successful Implementation:
- SonarQube: Integrates Cyclomatic Complexity as a key code quality metric, providing visualizations and reports.
- Microsoft Visual Studio: Calculates Cyclomatic Complexity for .NET applications, aiding developers in identifying complex code segments.
- Jenkins CI Servers: Often utilize plugins to track Cyclomatic Complexity over time, enabling trend analysis and proactive quality management.
Tips for Using Cyclomatic Complexity:
- Aim for a score under 10: Strive for a Cyclomatic Complexity under 10 for most functions and methods to ensure maintainability.
- Use alongside other metrics: Combine Cyclomatic Complexity with other software quality metrics for a comprehensive quality assessment.
- Set context-specific thresholds: Establish graduated thresholds based on the specific context and needs of your team and project.
- Refactor complex methods: Extract logic into smaller, more manageable functions to reduce Cyclomatic Complexity and improve code clarity.
Cyclomatic Complexity deserves its place in the list of essential software quality metrics because it provides a concrete, quantifiable measure of code complexity, enabling developers to identify areas for improvement and proactively address potential maintainability issues. By understanding and utilizing this metric, development teams can build more robust, maintainable, and ultimately, higher-quality software. Popularized by Thomas J. McCabe, its importance has been further advocated by influential figures like Steve McConnell (author of "Code Complete") and organizations like NIST.
2. Code Coverage
Code coverage is a crucial software quality metric that measures how much of your source code is executed during testing. It provides a quantitative assessment of the extent to which your tests exercise different parts of your application, expressed as a percentage. By identifying areas of the code that haven't been tested, code coverage helps improve test quality and reduce the risk of undetected bugs. This makes it a valuable asset in ensuring software reliability and maintainability, directly impacting software quality.

Several types of code coverage exist, each focusing on different aspects of the code:
- Statement Coverage: Measures the percentage of individual statements executed during testing.
- Branch Coverage: Measures the percentage of code branches (e.g., if-else conditions) taken during testing.
- Function Coverage: Measures the percentage of functions called during testing.
- Line Coverage: Measures the percentage of lines of code executed during testing. Often used interchangeably with statement coverage.
Code coverage is typically reported as a percentage, with 100% indicating that every relevant part of the code has been executed during testing. It can be measured at different levels, from unit tests that verify individual components to integration tests that assess interactions between modules, and finally, system tests that evaluate the entire application. Automation is key, and coverage tools are commonly integrated into testing frameworks and CI/CD pipelines to provide continuous feedback.
Examples of Successful Implementation:
- Google: Often targets around 60% code coverage for many services, prioritizing a risk-based approach over striving for 100%.
- Microsoft: Integrates code coverage extensively within its DevOps practices, using it to monitor and improve the quality of its software products.
- Financial Services: Highly regulated industries, like financial services, often mandate higher coverage targets (80-90% or more) for critical systems due to the potential impact of software failures.
Pros:
- Objective Measurement: Offers a quantifiable measure of testing thoroughness, allowing for objective comparisons and progress tracking.
- Untested Code Identification: Pinpoints gaps in testing, highlighting areas that require additional test cases.
- Testing Standards Enforcement: Supports the enforcement of minimum coverage requirements, promoting a culture of quality.
- Dead Code Detection: Helps identify unreachable or dead code, which can then be removed to simplify the codebase.
Cons:
- Not a Guarantee of Quality: High coverage doesn't necessarily equate to high-quality tests. Tests can achieve high coverage while still missing important edge cases or logical errors.
- Gaming the System: Developers might be tempted to write superficial tests just to inflate coverage numbers, without truly improving test effectiveness.
- False Sense of Security: Relying solely on coverage metrics can create a false sense of confidence, masking underlying issues.
- Testability Challenges: Some code, such as UI components or third-party integrations, can be inherently difficult to test, making achieving high coverage challenging.
Tips for Effective Use:
- Prioritize Critical Paths: Focus testing efforts on critical code paths and complex logic rather than aiming for 100% coverage across the board.
- Balance Cost and Risk: Weigh the cost of achieving higher coverage against the potential risks of untested code.
- Risk-Based Approach: Tailor coverage targets based on the risk profile of different parts of the application.
- Mutation Testing: Complement coverage metrics with mutation testing to assess the effectiveness of your tests in detecting faults.
- Track Trends: Focus on tracking coverage trends over time, rather than fixating on absolute numbers. A steady increase in coverage usually indicates improving test quality.
Popularized By:
Code coverage's importance in software development has been significantly influenced by figures like Kent Beck, through Test-Driven Development (TDD), and Martin Fowler, who advocates for a sensible and balanced approach to its use. Tools like JaCoCo (Java) and Istanbul (JavaScript) have also played a key role in making code coverage measurement accessible and practical.
3. Defect Density
Defect density is a crucial software quality metric that provides a quantifiable measure of the number of defects found in a software product relative to its size. It's a valuable tool for software engineers, quality assurance teams, and project managers seeking to understand and improve the quality of their software. This metric helps in identifying areas needing improvement, tracking progress, and benchmarking against industry standards, earning it a prominent place in the arsenal of software quality metrics.
How it Works:
Defect density is calculated by dividing the total number of confirmed defects found in a given piece of software by the size of that software. The size can be measured in various ways, most commonly using thousands of lines of code (KLOC) or function points. Thus, the formula is:
Defect Density = (Total Defects) / (Size of Software)
The result is typically expressed as defects per KLOC or defects per function point. For example, a defect density of 2.5 defects/KLOC means that 2.5 defects were found for every 1,000 lines of code.
Features and Benefits:
- Calculated by a straightforward formula: Its simplicity makes it easy to understand and implement.
- Measurable across different development phases: Tracking defect density throughout the software development lifecycle (SDLC), from requirements gathering to deployment, helps pinpoint stages where defects are introduced and caught.
- Segmentable by severity: Categorizing defects by severity (critical, major, minor) allows for prioritizing fixes and understanding the impact of different types of defects.
- Comparative metric: Comparing defect density across different projects, releases, or even modules within a project helps identify areas of strength and weakness. This facilitates targeted quality improvement efforts and resource allocation.
Pros:
- Provides a quantifiable measurement of software quality: Moving beyond subjective assessments, defect density provides concrete data for evaluating software quality.
- Helps in resource allocation for quality improvement: By highlighting areas with high defect density, teams can strategically allocate resources to address the most problematic areas.
- Useful for comparing quality across different releases or products: Tracking defect density over time allows teams to monitor quality trends and evaluate the effectiveness of improvement initiatives.
- Aids in identifying problematic modules or components: Pinpointing modules with higher defect density can lead to focused code reviews, refactoring, or redesign.
Cons:
- Different defect detection and reporting practices can skew results: Variations in how teams define, detect, and report defects can lead to inconsistent defect density measurements, making comparisons difficult.
- Size measurements (LOC, function points) have their own limitations: LOC can be affected by coding style, while function points can be subjective to assess. Both can impact the accuracy of the defect density calculation.
- Doesn't account for defect impact or user experience: A high number of minor defects might inflate the defect density while not significantly impacting the user experience. Conversely, a few critical defects could have a severe impact despite a seemingly low defect density.
- Can be manipulated by changing defect classification criteria: Altering the criteria for classifying defects can artificially lower or raise the reported defect density without actually improving software quality.
Examples of Successful Implementation:
- NASA's Software Assurance Technology Center targets a defect density of less than 0.1 defects per KLOC for mission-critical systems, emphasizing the importance of extremely high software quality in such applications.
- Microsoft utilized defect density as a key metric to improve the quality of Windows Vista compared to its predecessor, Windows XP.
- Organizations assessed at Capability Maturity Model Integration (CMMI) Level 5, representing the highest level of process maturity, typically aim for a defect density of less than 1.0 defect per KLOC.
Actionable Tips:
- Establish clear defect classification guidelines: Standardized defect classifications are crucial for consistent measurement and meaningful comparisons.
- Track defect density by phase: Identifying the stages of the SDLC where defects are introduced and caught helps improve the effectiveness of testing and quality assurance efforts.
- Use defect density in conjunction with defect removal efficiency: This combination provides a more comprehensive view of the software quality landscape.
- Compare against industry benchmarks for your domain: Benchmarking helps gauge your performance relative to industry standards and identify areas for improvement.
- Set improvement targets rather than absolute goals: Focusing on reducing defect density over time is more practical and motivating than aiming for arbitrary absolute values.
Popularized By:
The concept of defect density and its importance in software quality have been significantly influenced by individuals like Watts Humphrey (through the Personal Software Process), Capers Jones (a renowned software quality researcher), and the ISO/IEC 25023 quality measurement standard. Their work has helped establish defect density as a cornerstone of software quality measurement.
4. Mean Time Between Failures (MTBF)
Mean Time Between Failures (MTBF) is a crucial software quality metric that measures the average time a system operates without experiencing a failure. It provides a valuable insight into the reliability and stability of software applications, components, or entire systems over a defined period. As a key performance indicator within the broader category of software quality metrics, MTBF helps teams understand how frequently failures occur and, consequently, how dependable their software is. This is particularly critical for systems where downtime translates directly to revenue loss or safety risks.
MTBF is calculated by dividing the total operational time by the number of failures observed during that time. The result is usually expressed in hours or days. For example, an MTBF of 1,000 hours indicates that, on average, a failure occurs every 1,000 hours of operation.
How MTBF Works and When to Use It:
MTBF is most effective when dealing with repairable systems where failures are independent events. It's useful for:
- Assessing overall system reliability: A higher MTBF generally indicates a more reliable system. This information can be used to benchmark against industry standards or track improvements over time.
- Predicting future failures: While not a perfect predictor, MTBF can help estimate the likelihood of future failures and inform maintenance schedules.
- Capacity and maintenance planning: Knowing the average time between failures allows teams to plan for maintenance windows and resource allocation, minimizing disruptions.
- Negotiating Service Level Agreements (SLAs): MTBF is often used in SLAs to define expected uptime and reliability guarantees.
- Comparing different system versions: Tracking MTBF across different versions of a software system helps identify the impact of code changes on reliability.
Features and Benefits:
- Simple calculation: The straightforward formula makes it easy to calculate and understand.
- Clear communication: MTBF is a readily communicable metric that stakeholders and management can easily grasp.
- Proactive maintenance: It allows for proactive maintenance scheduling and resource allocation.
Examples of Successful Implementation:
- Amazon's EC2 service: Amazon targets high MTBF for its EC2 cloud computing platform to ensure high availability and reliability for its customers, often expressed in terms of uptime percentages like 99.99%.
- Banking systems: Financial institutions heavily rely on high MTBF for their core banking systems, often targeting MTBF values measured in months due to the critical nature of their operations.
- Google's Site Reliability Engineering (SRE): Google's SRE practices emphasize improving MTBF through proactive measures like error budgets and robust monitoring.
Pros and Cons:
Pros:
- Provides a clear indication of operational reliability.
- Easy to communicate to stakeholders.
- Helps in capacity and maintenance planning.
- Useful for comparing reliability across different versions.
Cons:
- Doesn't account for the severity or impact of failures. A minor glitch and a complete system outage contribute equally to the MTBF calculation.
- Assumes a random distribution of failures, which may not always be true for software systems. Software bugs often cluster around specific functionalities or usage patterns.
- Can be skewed by the definition of 'failure'. A broad definition will inflate the number of failures and lower the MTBF, while a narrow definition will do the opposite.
- Not as useful for infrequently used systems. With limited operational time, calculating a meaningful MTBF becomes difficult.
Actionable Tips for Improving MTBF:
- Define failure criteria clearly and consistently: Establish a precise definition of what constitutes a "failure" to ensure consistent measurement. Include specific error codes, performance thresholds, or user-reported issues.
- Use automated monitoring to accurately track outages and issues: Implement robust monitoring systems to capture all failures and downtime, providing accurate data for MTBF calculations.
- Combine with Mean Time To Repair (MTTR): MTTR measures the average time it takes to resolve a failure. Combining MTBF and MTTR offers a more comprehensive picture of system reliability.
- Consider including degraded performance as partial failures: Don't just focus on complete outages. Track performance degradation that impacts user experience, even if it doesn't cause a complete system failure.
- Segment by component to identify weak points in the system: Calculate MTBF for individual components or subsystems to pinpoint areas that require attention and prioritize improvements.
Popularized By:
MTBF has been popularized by several influential methodologies and practices including Site Reliability Engineering (SRE) at Google, the ITIL framework for IT service management, and W. Edwards Deming's quality management principles.
By effectively utilizing MTBF as part of a comprehensive software quality metrics strategy, development teams can proactively address reliability issues, minimize downtime, and build more robust and dependable software systems.
5. Technical Debt Ratio
Technical Debt Ratio is a crucial software quality metric that quantifies the cost of addressing code quality issues compared to the cost of rewriting the entire application. It essentially represents the percentage of the codebase requiring refactoring. A higher ratio signifies a greater accumulation of technical debt, indicating more significant maintenance challenges and potential future costs. This metric helps translate technical debt into a financial context, making it easier for both technical and non-technical stakeholders to understand its impact.

Often calculated as (Remediation Cost ÷ Development Cost) × 100%, the Technical Debt Ratio leverages static code analysis tools to measure and track code quality issues like code smells, duplications, and architectural weaknesses. These tools automate the process and provide a consistent framework for evaluation. The ratio can also be broken down by component or code area, providing a granular view of technical debt distribution across the application. This granularity allows teams to pinpoint specific areas requiring immediate attention. This software quality metric earns its place on this list due to its ability to bridge the gap between technical issues and business impact.
Features of Technical Debt Ratio include:
- Calculation: (Remediation Cost ÷ Development Cost) × 100%
- Measurement: Primarily through static code analysis tools
- Granularity: Can be broken down by component or code area
- Scope: Encompasses code smells, duplications, and architectural issues
Pros:
- Financial Context: Provides a tangible financial perspective on technical issues, facilitating better decision-making.
- Prioritization: Helps prioritize refactoring efforts by highlighting the most critical areas of technical debt.
- Visibility: Makes technical quality understandable and visible to non-technical stakeholders.
- Trend Tracking: Enables tracking of quality trends over time, allowing for proactive intervention.
Cons:
- Subjectivity: Estimating remediation costs can be subjective, potentially impacting the accuracy of the ratio.
- Tool Variance: Different static analysis tools may calculate the ratio differently, leading to inconsistencies.
- Oversimplification: May oversimplify complex architectural issues that require more nuanced analysis.
- Business Impact Correlation: Can be challenging to directly correlate the Technical Debt Ratio with specific business impacts.
Examples of Successful Implementation:
- SonarQube often uses a Technical Debt Ratio threshold of 5% within its quality gates, providing an automated check for code quality.
- Spotify leveraged technical debt tracking to maintain code quality during periods of rapid growth.
- The US Department of Defense utilizes technical debt metrics in their contractor assessment process.
Tips for Effective Utilization:
- Graduated Thresholds: Set different Technical Debt Ratio thresholds based on application criticality. Mission-critical systems should have stricter targets than less critical ones.
- Proactive Prevention: Focus on preventing new technical debt accumulation alongside addressing existing debt.
- Dedicated Time: Allocate specific time within each sprint or release cycle for debt reduction activities.
- Trend Focus: Track the trend of the ratio over time rather than fixating on absolute numbers. Improving trends indicate positive progress.
- Business Case Justification: Use the Technical Debt Ratio to build a compelling business case for refactoring and code improvement initiatives.
Learn more about Technical Debt Ratio for expert guidance. By effectively using the Technical Debt Ratio, development teams can proactively manage technical debt, improve software quality, and reduce long-term maintenance costs. It’s a powerful tool for anyone involved in the software development lifecycle, from developers and engineering managers to product managers and IT analysts.
6. Code Duplication (or Clone Detection)
Code duplication, also known as clone detection, is a crucial software quality metric that measures the extent of redundant code within a codebase. It identifies instances where identical or very similar code segments appear multiple times, highlighting potential maintenance nightmares and quality risks. This metric plays a vital role in ensuring code maintainability, readability, and reducing the risk of error propagation. Therefore, it deserves a prominent place in any list of essential software quality metrics used by Data Scientists, System Administrators, DevOps Engineers, DevEx Engineers, Cloud Engineers, Software Engineers, Mobile Engineers (Android and iOS), Engineering Managers, Agile Coaches, Product Managers, Risk and Compliance officers, Computer Science Teachers, and IT Analysts alike.
How it Works:
Code duplication analysis tools examine the source code, comparing segments to identify duplicates. These tools utilize various techniques, such as token-based comparison or abstract syntax tree (AST) analysis, to detect both exact matches and near-duplicates (code blocks that are similar but not identical). The extent of duplication is usually expressed as a percentage of duplicated lines or blocks of code. Furthermore, these tools can often be configured to analyze code at different granularities, from individual code blocks and methods to entire files, providing a comprehensive view of duplication within the project.
Features and Benefits:
- Quantifiable Measurement: Expressed as a percentage, making it easy to track and trend over time.
- Varied Detection Capabilities: Can detect exact duplicates as well as near-duplicates with slight variations (e.g., different variable names).
- Granular Analysis: Operates at different levels of detail, from blocks and methods to files.
- Improved Code Reuse and Abstraction: Identifying duplication often reveals opportunities to refactor and create reusable components, leading to more modular and maintainable code.
- Reduced Maintenance Costs: Fixing a bug in one location automatically addresses the issue in all duplicated instances, reducing the risk of inconsistencies and saving developer time.
- Enhanced Readability and Understandability: Less duplicated code typically translates to a cleaner and easier-to-understand codebase.
Pros and Cons:
- Pros: Identifies opportunities for code reuse and abstraction, reduces maintenance costs, improves code maintainability and readability, easy to communicate and understand.
- Cons: Some duplication may be intentional or justified (e.g., boilerplate code), over-abstraction can introduce unnecessary complexity, potential for false positives in generated code or standard patterns, varying detection capabilities across different tools.
Examples of Successful Implementation:
- Google enforces internal guidelines that typically limit code duplication to under 5%, highlighting the importance they place on code quality and maintainability.
- Apache uses clone detection as part of their quality gates, ensuring that new code contributions adhere to their standards for code cleanliness and maintainability.
- Financial systems often employ strict duplication thresholds to minimize the risk of error propagation, recognizing the potential financial impact of bugs replicated across multiple parts of their systems.
Actionable Tips:
- Focus on Meaningful Duplication: Don't get bogged down in trivial duplications. Concentrate on larger blocks of logic and frequently modified code.
- Rule of Three: A practical guideline is to refactor duplication only when a code segment is repeated three times. This balances the benefits of abstraction with the risk of over-engineering.
- Context Matters: Consider the domain context before refactoring. Sometimes, seemingly duplicated code serves distinct purposes and shouldn't be merged.
- Leverage Design Patterns: Familiarize yourself with design patterns that address common duplication scenarios.
- Tailored Thresholds: Set different duplication thresholds for different types of code (e.g., more stringent limits for production code than test code).
When and Why to Use Code Duplication Analysis:
Code duplication analysis should be integrated into the software development lifecycle, ideally as part of continuous integration and continuous delivery (CI/CD) pipelines. Regular monitoring of code duplication helps identify and address emerging issues early. This is particularly important for larger projects, projects with multiple contributors, and systems where code quality and maintainability are paramount (e.g., financial systems, healthcare applications).
Popularized By:
The concept of minimizing code duplication is deeply ingrained in refactoring principles, notably promoted by Kent Beck. Tools like PMD's CPD (Copy-Paste Detector) and SonarQube's duplication detection algorithm have made it easier to identify and manage duplicated code. By incorporating code duplication analysis into your software development practices, you contribute significantly to improved software quality metrics and a more robust and maintainable codebase.
7. Maintainability Index
Maintainability Index (MI) is a crucial software quality metric that provides a comprehensive evaluation of how easy it is to maintain and modify a given codebase. In the world of software development, where change is constant, understanding and tracking maintainability is vital for long-term project success. This metric deserves its place on this list of software quality metrics because it offers a holistic view of code health, going beyond simple measures like lines of code. For data scientists, DevOps engineers, software engineers, and engineering managers alike, MI offers valuable insights for managing technical debt and ensuring the sustainability of software projects.
MI works by combining multiple factors that influence maintainability into a single, quantifiable index. These factors traditionally include:
- Cyclomatic Complexity (CC): Measures the number of independent paths through a piece of code, reflecting its complexity and testability. Higher CC generally suggests lower maintainability.
- Lines of Code (LOC): While not a perfect measure, a large number of lines of code can indicate potential maintainability challenges.
- Halstead Volume (HV): A measure of program size and complexity based on the number of operators and operands.
The original formula for calculating MI is quite complex: MI = 171 - 5.2 * ln(HV) - 0.23 * CC - 16.2 * ln(LOC) + 50 * sin(sqrt(2.4*CM)), where CM represents the percentage of comment lines. However, modern implementations often employ simplified versions of this formula. The MI is typically scored on a scale of 0 to 100, with higher scores indicating better maintainability.
Features and Benefits:
- Holistic View: MI incorporates multiple dimensions of code quality, offering a more comprehensive assessment than single-factor metrics.
- Trend Tracking: The single index value simplifies tracking maintainability trends over time and across different projects.
- Cost Correlation: MI correlates with maintenance effort and costs, providing a valuable input for project planning and resource allocation.
- Problem Identification: MI can pinpoint problematic code modules that require refactoring, helping to prioritize improvement efforts.
Pros and Cons:
- Pros: Provides a holistic view of code maintainability, single number for easy tracking, correlates with maintenance costs, identifies problematic code for refactoring.
- Cons: Original formula is complex and can be difficult to interpret, variations in implementation across different tools, may overemphasize code length, doesn't account for factors like documentation or test coverage.
Examples of Successful Implementation:
- Microsoft Visual Studio: Integrates MI as a standard code metric, providing developers with readily available maintainability information.
- US Air Force: Utilized MI to assess and improve the maintainability of legacy systems.
- Nokia: Leveraged MI within its mobile division to enhance code quality across development teams.
Actionable Tips:
- Prioritize Refactoring: Use MI to identify modules with the lowest scores and prioritize them for refactoring efforts.
- Track Trends: Focus on tracking MI trends over time to identify improvements or regressions in maintainability, rather than fixating on absolute values.
- Combine with Specific Metrics: Use MI in conjunction with more specific metrics like cyclomatic complexity and code duplication to understand the underlying causes of low MI scores.
- Set Thresholds: Establish appropriate MI thresholds based on the specific technology stack, project domain, and organizational standards.
- Early Warning System: Utilize MI as an early warning system for the accumulation of technical debt.
Learn more about Maintainability Index for practical tips on incorporating this metric into your code review process and driving software excellence. By leveraging MI effectively, development teams can proactively address maintainability issues, reduce development costs, and build more sustainable software. For roles ranging from IT analysts to cloud engineers and product managers, understanding and utilizing software quality metrics like MI is essential for delivering high-quality and maintainable software.
Software Quality Metrics Comparison
| Metric | Implementation Complexity 🔄 | Resource Requirements ⚡ | Expected Outcomes 📊 | Ideal Use Cases 💡 | Key Advantages ⭐ | |-------------------------|----------------------------------------------------|-----------------------------------------------|------------------------------------------------------|-------------------------------------------------------------|--------------------------------------------------| | Cyclomatic Complexity | Low to moderate; requires control flow graph analysis | Low; automated by static analysis tools | Identifies code complexity, maintainability risks | Code quality monitoring, refactoring, test planning | Strong maintainability indicator; language-agnostic | | Code Coverage | Moderate; needs instrumented testing setup | Medium to high; requires comprehensive tests | Measures test thoroughness and untested code | Test effectiveness evaluation, quality gates | Objective test coverage measure; identifies dead code | | Defect Density | Moderate; needs defect tracking and size measurement | Medium; requires defect logging and code metrics | Quantifies software defects relative to size | Quality benchmarking, release readiness, resource planning | Quantifiable quality measure; highlights defect-prone modules | | Mean Time Between Failures (MTBF) | Low; requires failure/event logging | Medium; needs operational monitoring systems | Measures average uptime between failures | Reliability assessment, SLA compliance, maintenance planning | Clear reliability indicator; easy communication | | Technical Debt Ratio | Moderate; requires remediation cost estimation | Medium; needs static analysis and cost models | Quantifies technical debt relative to development cost | Prioritizing refactoring, communicating debt impact | Links technical issues to financial impact | | Code Duplication | Low to moderate; uses token/tree comparisons | Low; supported by many static code analysis tools| Detects redundant code segments | Reducing maintenance burden, improving code quality | Identifies reuse opportunities; improves maintainability | | Maintainability Index | Moderate to high; combines multiple complex metrics | Medium; automated tools calculate composite index | Overall maintainability score | Tracking code health, refactoring prioritization | Holistic maintainability view; trend tracking |
Putting Metrics to Work: Boosting Code Quality with Pull Checklist
Software quality metrics, encompassing crucial indicators like cyclomatic complexity, code coverage, defect density, MTBF, technical debt ratio, code duplication, and maintainability index, provide invaluable insights into the health and sustainability of your software projects. Mastering these metrics empowers you to identify potential problems early, streamline development processes, and ultimately deliver higher-quality software that meets user expectations and business objectives. Remember, these metrics aren't just numbers; they represent tangible aspects of your codebase that directly impact development speed, cost, and risk. By focusing on improving these metrics, you invest in the long-term success of your projects and build a more robust and maintainable codebase.
The key takeaway here is that understanding and actively monitoring these software quality metrics is essential for any successful software development team. From preventing costly bugs to reducing technical debt and fostering a culture of quality, the benefits are far-reaching. By integrating these metrics into your daily workflow, you shift from reactive problem-solving to proactive quality management, leading to more predictable development cycles and more satisfied stakeholders.
Ready to elevate your code quality and streamline your code review process? Pull Checklist makes it easy to integrate software quality metrics directly into your pull requests, ensuring that code standards are met and regressions are caught before they reach production. Start building better software today by exploring how Pull Checklist can help you enforce code quality and boost team collaboration.