Availability vs Uptime: What Really Matters for Reliability

The Hidden Truth About Availability vs. Uptime

Many IT professionals use the terms availability and uptime interchangeably. This is a mistake. While seemingly similar, understanding the difference between these two metrics is critical for a robust reliability strategy. Overlooking this nuance can lead to significant oversight and a false sense of security.
Uptime offers a binary perspective: a system is either up or down. This simplicity, while useful, ignores the complexities of real-world user experience. Availability, on the other hand, paints a much more complete picture of service quality. It considers performance degradation, partial outages, and other factors impacting users even when the system isn't technically "down." This is the core of the "hidden truth."
Beyond the Binary: Why Uptime Isn't Enough
Imagine an e-commerce site boasting 99.9% uptime. Sounds impressive, right? Now, consider what happens if that same site slows to a crawl during peak shopping hours. Technically, the site is still "up," meeting that 99.9% target. But for customers struggling to load pages or complete transactions, the site is effectively unusable. Uptime remains high, but availability plummets, resulting in lost revenue and frustrated customers. Resources like this Roadmap can guide you toward better reliability programs.
Simply pinging a server provides limited insight. While a ping confirms the server responds, it doesn't guarantee the service itself is functional. A system might be "up" but unable to process transactions, serve web pages, or connect to databases. This scenario underscores the limitations of relying solely on basic uptime monitoring.
Defining Uptime and Availability
Industry standards typically define uptime as the percentage of time a system is operational. Major cloud providers, for instance, track uptime against the total monitored period, such as a year. A target of 99.9% uptime – often referred to as “three nines” – translates to approximately 8.76 hours of downtime per year (0.1% of a non-leap year's 8,760 hours). This figure is a common element in IT and web service SLAs.
However, as we’ve discussed, uptime doesn’t capture the full story. It doesn't reflect the impact of poor performance or partial outages. Availability metrics, conversely, encompass all instances where the system fails to deliver the expected service quality. This critical difference is vital when defining SLAs and setting realistic reliability expectations. Want to explore this concept further? Discover more insights into the crucial distinction between uptime and availability.
Why Your 99.9% Uptime Is Lying to You
That 99.9% uptime badge on your status page might look impressive, but it often masks a less-than-ideal user experience. While uptime reports can be useful, they don't tell the whole story. Many organizations maintain high uptime while simultaneously failing to deliver a smooth, reliable service to their users. This gap between reported uptime and actual user satisfaction creates a dangerous blind spot.
The Illusion of Uptime
Focusing solely on uptime metrics can foster a false sense of security. Imagine a scenario: your system is technically online, thus registering as "up," but response times have slowed to a crawl. From a user's perspective, the system is effectively unusable. This disconnect highlights the critical flaw in relying solely on traditional uptime monitoring. Uptime simply means the system is running. Availability, on the other hand, measures whether the system is actually performing its intended function. It captures a broader range of issues that directly impact users, including performance degradation, increased error rates, and partial outages.
Consider an online banking platform proudly displaying its 99.9% uptime. However, during peak business hours, the system becomes sluggish, making transactions excruciatingly slow. Technically, the system is “up,” but the degraded performance renders the service unavailable for many users. This exact scenario is what basic uptime tracking misses, leading to an inaccurate picture of system health. In today's competitive market, users prioritize a quality experience. Abstract uptime statistics won't appease frustrated customers.
The Real Cost of Downtime vs. Unavailability
The difference between perceived uptime and actual availability can be substantial. Many organizations aim for 99.9% or even 99.99% uptime, but the actual user experience—governed by availability—often falls far short. A recent study analyzing a business-critical web service illustrates this point. The system boasted approximately 99.9% uptime, experiencing only 117 minutes of complete downtime in a typical month. However, the same system suffered an additional 2,096 minutes (over 34 hours) of performance issues, including slow response times and high error rates. When these issues are factored in, the effective availability plummeted to around 97.5% – a significant discrepancy. Learn more about uptime vs. availability.
This disparity emphasizes the fundamental distinction between downtime (system completely offline) and unavailability (system not functioning as expected). While downtime certainly contributes to unavailability, it's only part of the equation. Performance degradation, errors, and even scheduled maintenance contribute to periods of unavailability, even if the system is technically running. This broader understanding of service disruptions is crucial for establishing accurate SLAs and grasping the real impact on users. Ultimately, fixating solely on uptime creates a distorted view of reliability, masking problems that directly impact user experience and, consequently, business success.
Smart Monitoring That Actually Reveals System Health
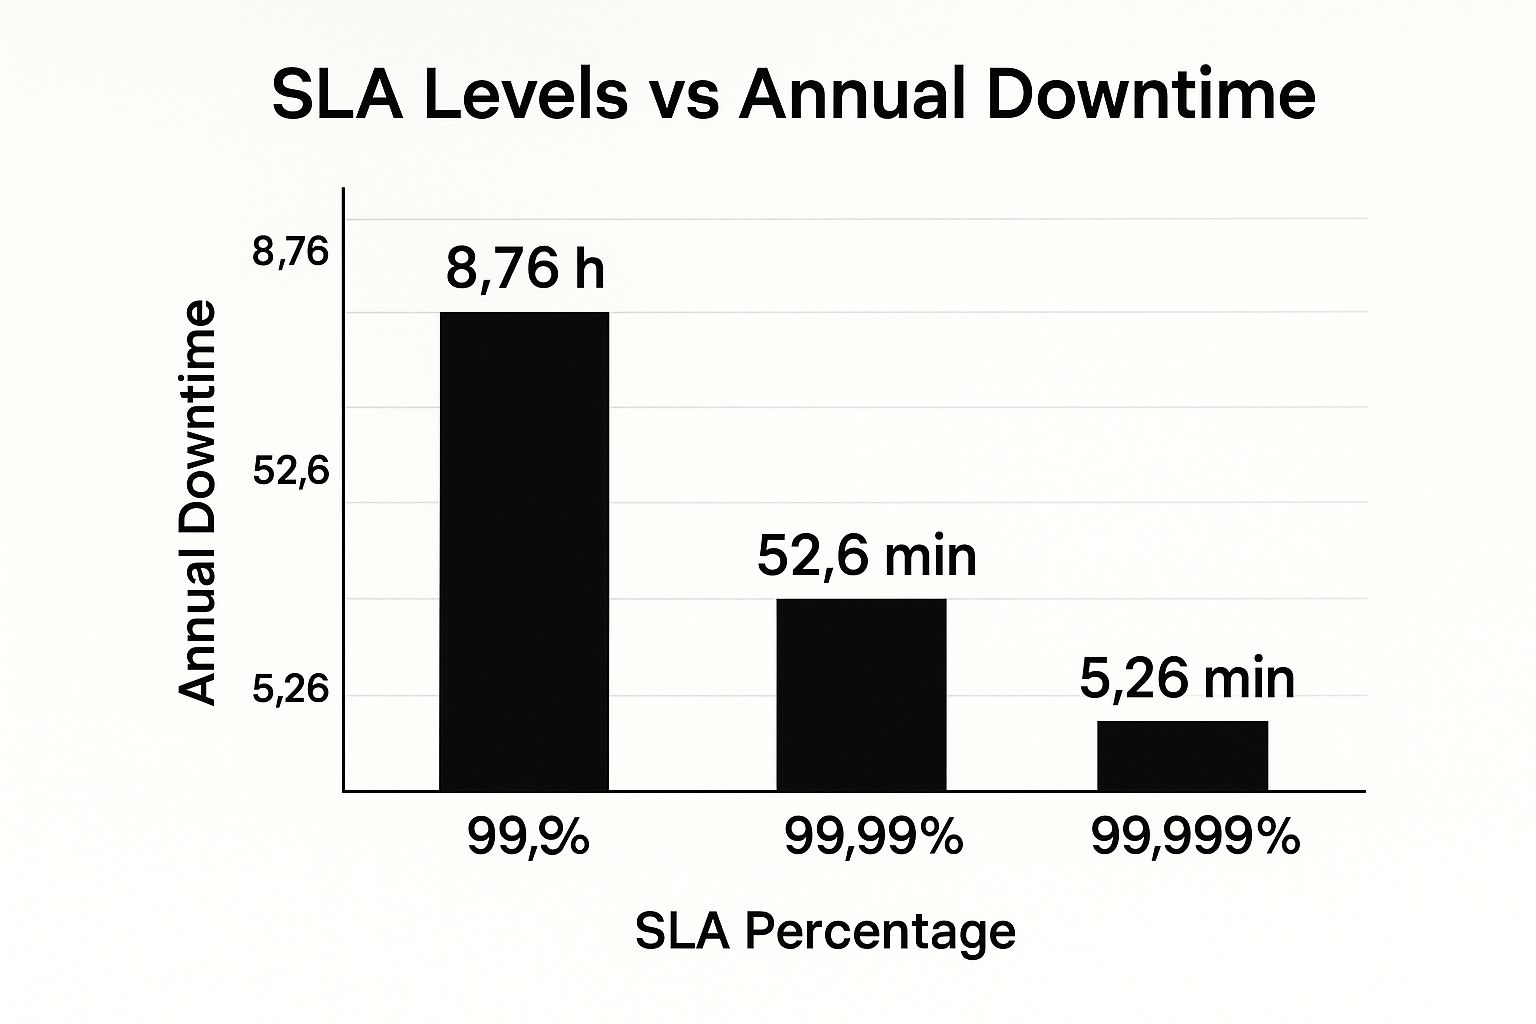
This infographic neatly illustrates how SLA percentages correlate with potential downtime. Notice the substantial difference in downtime between 99.9%, 99.99%, and 99.999% availability. Each additional "nine" represents a significant decrease in service interruptions, highlighting the importance of a solid reliability strategy.
Effective system monitoring goes far beyond simple ping tests. It requires a deeper understanding of the nuances between uptime and availability, focusing on the actual user experience. This shift necessitates moving away from binary "up/down" checks and embracing more sophisticated monitoring techniques like synthetic monitoring and Real User Monitoring (RUM).
Synthetic Monitoring: Proactive Issue Detection
Synthetic monitoring proactively identifies potential issues by simulating user interactions. Scripted tests mimic common user workflows, such as logging in or completing a purchase. These tests run continuously from various locations, providing valuable performance data under different conditions and allowing you to catch problems early on.
Imagine being able to identify a broken checkout process before your customers encounter it during a peak sales period. That’s the power of synthetic monitoring. It helps you stay ahead of potential disruptions and maintain a smooth user experience. Tools like Pingdom offer robust synthetic monitoring solutions.
Real User Monitoring: The Authentic Experience
RUM provides a real-time view into the actual user experience. By collecting data from real users interacting with your system, RUM offers authentic performance insights. Metrics like page load times, error rates, and transaction durations provide a clear picture of the quality of service your users are receiving. This data is crucial for pinpointing areas for improvement and understanding the true impact of performance bottlenecks.
RUM gives you the unfiltered truth about your users' experiences. It reveals not just if something is wrong, but how it's impacting your users. This information is invaluable for prioritizing improvements and making data-driven decisions. Consider exploring tools like New Relic for powerful RUM capabilities.
Hybrid Approaches: Complete Performance Visibility
Combining synthetic and real user monitoring provides a comprehensive view of system health. Synthetic monitoring excels at proactive detection, while RUM provides the authentic user perspective. This integrated approach lets you identify potential issues before they impact users and then confirm the real-world impact on actual usage patterns.
To understand this combined power, think of synthetic monitoring as your early warning system and RUM as your ground truth confirmation. Together, they provide a holistic view of system performance, enabling you to prioritize issues based on their impact on your users, not just technical indicators.
To further illustrate the strategic differences between these approaches, consider the following table:
Uptime vs Availability Monitoring Approaches
Strategic comparison of monitoring methods, tools, and business impact for uptime versus availability tracking
| Monitoring Focus | Measurement Approach | Key Performance Indicators | Business Impact Assessment | |---|---|---|---| | Uptime | Server-side monitoring (ping tests, port checks) | Server response time, connection status | Indicates if the server is reachable, but doesn't reflect user experience | | Availability | Synthetic monitoring, RUM | Page load times, error rates, transaction durations, synthetic test success rates | Measures actual user experience and proactively identifies potential issues |
The table above highlights how focusing solely on uptime provides a limited perspective. While important, uptime alone doesn’t tell the whole story. Availability monitoring, through synthetic testing and RUM, provides a much richer understanding of system health from the user’s point of view.
By leveraging both methodologies, organizations can establish meaningful baselines, build more effective alerting systems, and ultimately, deliver a better user experience. This leads to more efficient troubleshooting and a more reliable service overall.
Crafting SLAs That Protect Your Business Interests

Traditional Service Level Agreements (SLAs) often prioritize uptime. This narrow focus can lead to disputes and unmet expectations, as it overlooks the nuances of actual user experience. A more robust approach integrates both uptime and availability metrics, ensuring the agreement reflects real-world performance and safeguards your business interests.
Designing Agreements for Real-World Scenarios
When designing SLAs, consider how users interact with your systems. Availability encompasses response times, error rates, and transaction success rates, offering a more accurate representation of service quality than uptime alone. Going beyond basic uptime allows your SLA to reflect the true user experience and prevents disagreements stemming from discrepancies between technical uptime and perceived availability.
To improve SLAs, consider incorporating customer support automation. Automating aspects of customer support can enhance responsiveness and user satisfaction, especially during critical incidents.
For instance, a 99.9% uptime SLA may appear sufficient. However, if the system suffers slowdowns or errors during peak usage, the effective availability is significantly lower. Your SLA should account for this by including metrics that capture these performance degradations. Metrics like average response time and error rate, combined with uptime, paint a more comprehensive picture of system health.
Penalty Structures and Measurement Windows
Penalty structures should correspond to the actual business impact of service disruptions. A minor performance hiccup shouldn't carry the same financial penalty as a complete outage. Likewise, measurement windows should mirror real-world usage patterns. A continuous 24/7 measurement window may not be suitable for a system primarily used during business hours.
Consider a system heavily used for processing online orders during specific peak periods. The SLA should prioritize performance during these crucial times, potentially with stricter penalties for disruptions. This targeted approach ensures penalties align with the real business impact, incentivizing the service provider to prioritize critical periods.
Exception Handling and Continuous Improvement
SLAs should include exception handling for planned maintenance and unforeseen external factors outside the service provider's control. This prevents unfair penalties and promotes transparency.
Furthermore, incorporate mechanisms for continuous improvement. Regularly review and update your SLAs based on performance data and evolving business needs. This iterative process ensures the agreement remains relevant and effectively protects your interests.
To provide a structured approach to comparing SLA types, let's examine the following table:
SLA Structure Comparison Framework
Analysis of uptime-focused versus comprehensive availability-based service level agreements
| Agreement Type | Performance Metrics | Target Thresholds | Business Risk Coverage | Dispute Likelihood | |---|---|---|---|---| | Uptime-focused | Uptime | 99.9% | Limited to complete outages | Higher due to lack of nuanced performance metrics | | Availability-focused | Uptime, Response Time, Error Rate, Transaction Success Rate | 99.9% uptime, <200ms response time, <1% error rate, 99.95% transaction success rate | Comprehensive, covers performance degradations and outages | Lower due to specific performance expectations |
This table highlights the key differences between traditional uptime-focused SLAs and the more comprehensive availability-focused approach. As shown, relying solely on uptime leaves significant gaps in business risk coverage and increases the likelihood of disputes.
By transitioning from a purely uptime-centric approach to a holistic view that incorporates availability, you create SLAs that truly represent the performance and reliability of your services. This fosters a stronger partnership with your service providers and a better experience for your users. This proactive approach to SLA management is essential for a robust reliability strategy.
What Major Providers Don't Tell You About Reliability
The marketing for major cloud providers often boasts impressive uptime, often focusing on the coveted "five nines" (99.999%) availability. But the reality of achieving and maintaining this level of reliability is much more complex. This section explores the disconnect between marketing promises and the practical challenges of delivering consistent, high-quality service.
The Five Nines Fallacy
The pursuit of "five nines" availability, translating to just 5.26 minutes of downtime annually, has become an industry standard. While a valuable aspiration, it's essential to understand its complexities and limitations. Even the biggest cloud providers struggle to consistently reach this ideal.
Achieving 99.999% uptime means less than six minutes of total downtime per year. Industry giants like AWS, Google Cloud, and Microsoft Azure rarely, if ever, consistently hit this mark. For a more detailed look at the historical data and the difficulties in achieving this uptime, discover more insights here. This highlights the importance of understanding the difference between availability and uptime, and how each is measured.
Balancing Technical Limitations and Customer Expectations
Maintaining such high availability requires substantial investments in infrastructure, redundancy, and advanced monitoring systems. Even with these resources, providers face unavoidable technical limitations and unpredictable events that can disrupt service.
Factors ranging from hardware failures and software bugs to natural disasters and human error can all lead to downtime. Providers must constantly balance these technical realities with customer expectations, making strategic choices about resource allocation.
This often means prioritizing certain services or regions, resulting in varying availability across different offerings. For example, core compute services might be prioritized over less critical features, leading to potentially lower availability for the latter.
Incident Response and Communication
A provider's incident response reveals its true priorities. How quickly and effectively do they communicate during outages? What compensation models are in place for service failures? These factors provide insight into the provider's commitment to reliability and their willingness to take responsibility.
Effective communication during outages is crucial. Transparency and timely updates can lessen the negative impact on customers. Providers prioritizing clear, proactive communication demonstrate a customer-centric approach and build trust, even in difficult situations. For a deeper understanding of how providers measure and strive for high availability, check out this resource on Software Quality Metrics.
Compensation for service failures also plays a vital role. Fair and transparent compensation not only mitigates the financial impact on customers but also demonstrates accountability. These policies should be clearly defined within the service level agreement (SLA) and easily accessible. Understanding these nuances allows for informed decisions when selecting a provider and setting realistic expectations for service reliability.
Choosing Your Reliability Strategy Based on Real Business Needs
Not every system needs the same level of reliability. Understanding the difference between uptime and availability gives you a real strategic advantage. Picking the right strategy depends on your specific business needs, what your users expect, and what your technical limitations are.
Contextual Decision-Making for Reliability
Sometimes, simple uptime monitoring is enough. For internal tools that people use on a flexible schedule, a simple "is it up or down?" check might be all you need. But for mission-critical systems, like e-commerce platforms or financial trading applications, every second of downtime means real financial losses. That’s when comprehensive availability monitoring is essential. The image below illustrates the concept of High Availability:
This diagram shows how redundant components work together to keep the service running. Even if one part fails, the system as a whole stays operational. This is the core idea behind High Availability. For more on reliable CI/CD pipelines, take a look at this guide on CI/CD best practices.
Think about a system that processes overnight batch jobs. Uptime is important, but short periods of downtime aren't as critical as they would be for a real-time trading platform. Understanding how your system works helps you determine the right balance between uptime and availability monitoring.
Evaluating Trade-Offs in Monitoring
Investing in full availability monitoring comes with trade-offs. Advanced monitoring systems require more resources – both infrastructure and expertise. You need to carefully weigh the cost of these resources against the potential losses from poor performance and downtime. This analysis should include both the direct financial impact of outages and the indirect costs, like losing customer trust and damaging your brand's reputation.
Aligning SLA Structures with Business Priorities
Your Service Level Agreements (SLAs) should reflect your business priorities. A simple uptime SLA might not be enough for systems where even small performance issues can have big consequences. In those cases, your SLAs should include availability metrics like:
- Response time
- Error rate
- Transaction success rate
This makes sure your agreement reflects the service quality you expect and protects your organization. By thinking carefully about these factors, you can create a reliability strategy that fits your unique needs. This strategic approach to availability vs. uptime not only reduces risk but also helps you use your resources effectively and makes sure your users have the best possible experience.
Your Roadmap to Better Reliability Programs
Building a robust reliability program is a journey, not a destination. Whether you’re just starting with basic uptime checks or transitioning to a more mature availability-focused model, a clear roadmap is essential. This section offers practical steps to achieve measurable improvements in your reliability efforts, emphasizing the importance of understanding the return on investment (ROI). When budgeting for reliability, considering resources like this article on Automation ROI can be incredibly valuable.
Step-By-Step Implementation Strategies
Begin by honestly assessing your current monitoring capabilities. Are you still relying solely on simple ping tests? If so, your first step should be implementing synthetic monitoring using tools like Pingdom. This involves simulating user interactions to proactively catch potential problems before they affect your users.
Think of it like a dress rehearsal before a big performance. Synthetic monitoring helps identify and address issues behind the scenes, ensuring a smoother experience for the actual audience.
Next, incorporate Real User Monitoring (RUM). While synthetic monitoring provides a controlled test environment, RUM captures the real-world user experience by gathering data from actual user interactions. RUM tools like New Relic offer valuable insight into authentic performance, highlighting areas for improvement that might be missed by synthetic tests alone.
For teams moving from uptime-focused to availability-centric monitoring, effective change management is crucial. Clearly communicate the why behind this shift. Explain how availability provides a more accurate reflection of the actual user experience than simple uptime percentages. Improved reliability also impacts development practices. This post on how to improve your code review process highlights the connection between code quality and overall system reliability.
Building Stakeholder Buy-In
Getting stakeholder buy-in is essential for any reliability investment. Frame technical improvements in terms of business outcomes. Instead of focusing on technical jargon like "99.99% uptime," translate that into tangible benefits like reduced lost sales, increased customer satisfaction, and a stronger brand reputation. Quantify the potential financial impact of outages and performance problems on the bottom line. This makes the value of reliability clear to everyone, not just the technical team.
Setting Realistic Performance Targets
Establish performance targets that align with your specific business needs. Don’t chase arbitrary metrics like “five nines” availability if your business doesn’t require it. A practical approach involves setting targets that balance the cost of achieving higher reliability with the potential business impact of disruptions. A luxury e-commerce site, for example, might prioritize high availability more than a small blog.
Measuring and Driving Continuous Improvement
Finally, create a measurement program that supports continuous improvement. Track key metrics such as response times, error rates, and customer satisfaction scores. Regularly review your monitoring setup and Service Level Agreements (SLAs), adjusting them as needed based on performance data and evolving business requirements. This iterative approach ensures your reliability program remains effective and relevant.
By taking these practical steps, you can build a reliability program that not only strengthens your technical infrastructure but also directly contributes to a better user experience and drives business success. Interested in improving your code review process and boosting your reliability efforts? Check out Pull Checklist.