Agile Velocity Tracking: Transform Team Performance Today


Demystifying Agile Velocity: Your Team's Performance Compass

Imagine training for a marathon. You wouldn't assess your fitness based on one slow run, would you? Agile velocity tracking is similar. It's not about judging individual sprints, but understanding your team's sustainable pace over the long haul. It's about finding your team's work rhythm.
Many teams fixate on speed when thinking about velocity. But experienced Scrum Masters know predictability is where velocity truly shines. Think of it as your team's performance compass, guiding realistic planning and dependable delivery. It's not about theoretical top speed, but consistent real-world performance.
Consistency trumps bursts of speed. A steady running pace is more sustainable than all-out sprints. Similarly, consistent velocity enables reliable planning and forecasting. This translates to fewer missed deadlines, happier stakeholders, and a more predictable development cycle. Data-driven conversations replace guesswork.
Agile velocity tracking focuses on capacity, not just output. Output is the what – the number of story points completed. Capacity is the how – the team's available time and resources. This is a critical distinction. Two teams might deliver the same number of story points, but the team with greater capacity has more flexibility to handle shifting priorities and unexpected roadblocks.
Agile velocity tracking has become essential for teams to understand their performance and predict future outcomes. A reliable baseline, built from historical data, is key. Teams often use the average velocity over three to five sprints to smooth out anomalies and create a more stable capacity estimate. It's like tracking your average running pace over several weeks, rather than focusing on a single run affected by outside factors. For a more in-depth look at velocity in Agile, check out this resource: Learn more about velocity tracking here. Ultimately, understanding the difference between output and capacity transforms velocity tracking from a simple metric to a powerful tool for continuous improvement and better team communication.
Cracking The Velocity Math Without The Headaches
Calculating agile velocity doesn't have to be a burden. Think of it like figuring out your average running speed. You add up the distances you've run over a few days and divide by the number of runs, right? Agile velocity is similar – it's all about understanding your team's consistent pace.
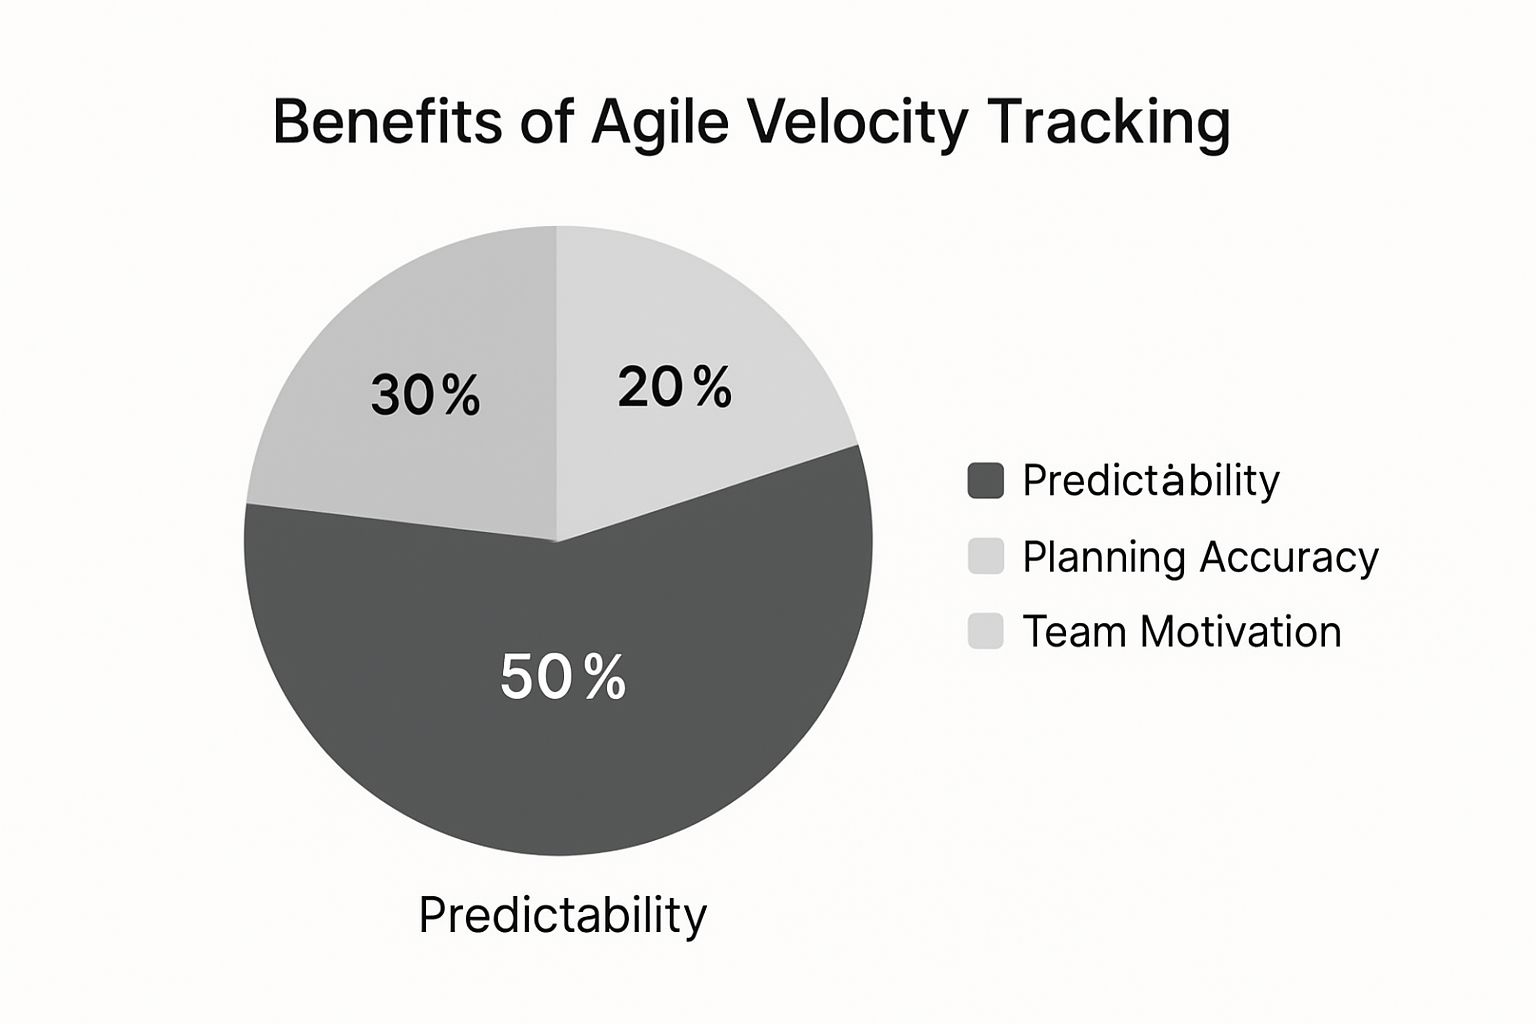
The infographic above shows the advantages of keeping track of agile velocity, broken down into Predictability, Planning Accuracy, and Team Motivation. Notice how predictability offers the biggest benefit (50%), followed by planning accuracy (30%) and team motivation (20%). This highlights how crucial velocity tracking is for forecasting and planning.
Simple Average Velocity
The simplest way to calculate velocity is by adding up all the story points your team finished over a few sprints and then dividing by the number of sprints. This gives you a basic idea of your team’s typical output. For instance, if a team finishes 20, 25, and 30 story points over three sprints, their average velocity is 25 story points per sprint.
Rolling Average Velocity
A rolling average offers a more responsive view. It looks at a fixed number of recent sprints to account for any changes in the team's performance. A three-sprint rolling average, for example, would only use the velocity from the last three sprints. This helps to smooth out the impact of any unusual sprints, like one affected by unexpected absences.
Let's look at a comparison of different calculation methods to better understand their strengths and weaknesses.
To help visualize these different approaches, let's look at the following table:
| Method | Best Used When | Pros | Cons | Example Calculation | |---|---|---|---|---| | Simple Average | Team is stable, workload is consistent | Easy to understand and calculate | Doesn't reflect recent changes in performance | (20 + 25 + 30) / 3 = 25 | | Rolling Average (3-sprint) | Team performance fluctuates, adapting to changes | More responsive to recent trends | Can be influenced by short-term anomalies | (25 + 30 + 22) / 3 = 25.67 | | Weighted Average | Want to emphasize recent sprints more | Gives more weight to recent performance | More complex to calculate | (25 * 0.2) + (30 * 0.3) + (22 * 0.5) = 26 |
This table summarizes the key differences between these common velocity calculation methods. While the simple average provides a straightforward baseline, the rolling average offers more up-to-date insights. The weighted average allows for even finer control but requires more complex calculations.
Handling Partial Stories and Special Tasks
It's important to remember that unfinished stories don’t count toward velocity. Only the points from fully completed user stories are included. Tasks like spikes (exploratory work) and research often don't have story points attached. Some teams assign them a few points, while others track them separately. The key here is to pick an approach and stick with it for consistency. Teams using Kanban might find a different approach to managing these tasks. You can explore how Kanban can integrate with agile for non-technical teams by checking out resources like Kanban for non-technical teams.
Different Estimation Scales and Team Changes
Teams use different scales for story points, such as Fibonacci sequences, linear scales, or even t-shirt sizes. No matter which scale you use, the calculation method stays the same. However, changes in the team do affect velocity. New team members need time to get up to speed, while departures reduce capacity. After any significant team changes, it’s wise to reset and recalculate your baseline velocity.
Accounting for Holidays and Scope Shifts
Holidays and planned time off reduce the number of working days in a sprint, and this directly affects velocity. Remember to adjust your velocity calculations accordingly. For example, if a sprint has 20% fewer working days due to holidays, you should also reduce the expected velocity by 20%. Similarly, any scope changes that occur mid-sprint can impact how many story points are completed. Documenting these changes helps you understand how they affect your velocity. Taking these factors into account ensures your agile velocity tracking paints an accurate picture of the team’s true performance.
Starting Strong: Building Velocity Tracking That Sticks
Rolling out agile velocity tracking is like introducing a new workout routine. Start too hard, and the team will quickly give up. Too easy, and you won't see any real benefit. This guide will walk you through setting up velocity tracking in a way your team will actually embrace, not just tolerate.

This screenshot shows Jira, a common project management tool often used for agile velocity tracking. The board view lets teams visualize their workflow and see how tasks are progressing, which contributes to accurate velocity calculations. Being able to see progress and spot potential roadblocks makes tools like Jira really helpful for effective velocity tracking. It gives everyone a quick understanding of the current status so the team can adjust as needed. Sometimes when starting with velocity tracking, it’s useful to understand the background tech that might impact the team. For example, knowing how to build a chatbot might be relevant to some projects.
Building Team Buy-In
Getting buy-in, especially from skeptical developers, is essential. Many have seen metrics initiatives fail in the past. Begin by explaining the why behind velocity tracking. Focus on how it benefits the team, not just management.
Highlight advantages like better planning, less crunch time, and more realistic deadlines. For instance, explain how understanding velocity can help the team avoid over-committing during sprint planning.
Choosing the Right Tools
Pick tools that fit seamlessly into your existing workflows. Stay away from complex systems that need extensive training or lots of manual data entry. The screenshot above demonstrates how helpful visual tools are for tracking velocity. Ideally, tracking velocity should feel natural, not like an extra chore. Tools like Jira, as seen in the screenshot, provide visualization and tracking that integrates with your development process.
Avoiding Over-Engineering
Don't overthink your tracking system. Keep it simple at first. Track basic story points completed per sprint. As your team gets more experience with velocity tracking, you can explore more advanced methods, like rolling averages or weighted calculations.
This gradual approach helps the team adapt without feeling overwhelmed. Remember, the goal is useful data, not complicated reports.
Adapting to Your Team
Every team is different. If your team is new, focus on establishing a baseline velocity over the first few sprints. If the team is already established, you can refine existing practices.
Be flexible and adapt your approach based on the team's specific needs. A new team might start with simple average velocity, while an experienced team could explore rolling averages for more in-depth insights.
Course Correcting When Needed
Don't hesitate to change your approach if something’s not working. If your initial method isn't helpful, re-evaluate and adjust. Regular retrospectives are a great time to discuss what's working well and what could be improved.
These discussions help refine the approach and make sure velocity tracking stays a valuable tool for the team. A small tweak to how story points are assigned, or how velocity is calculated, can sometimes make a big difference. The key is to be open to feedback and adapt. This iterative approach will help you create a sustainable and effective system.
From Numbers To Strategy: Planning With Velocity Data

This image shows a team discussing project progress, highlighting how important clear communication is when using velocity data for strategic planning. Think of it like meteorology: just as weather experts use patterns to forecast, agile velocity tracking helps product managers and Scrum Masters turn raw numbers into insightful predictions. This section explores how velocity trends can become reliable business insights, leading to realistic project timelines and smart decisions.
Translating Velocity Into Business Language
Velocity isn't just for the development team. It's a powerful tool for talking to stakeholders. But stakeholders often don't think in "story points." Your job is to translate your team's velocity story into business value.
Instead of saying, "We completed 25 story points," try something like, "Based on our velocity, we delivered the core features of the new user authentication system this sprint." This connects velocity to tangible progress that everyone can understand.
Realistic Timelines and Scope Management
Let's be honest: software development can be unpredictable. Velocity tracking gives you a data-driven basis for setting realistic timelines. By understanding your team's past velocity, you can estimate how much work they can realistically handle in future sprints and manage backlogs better. This leads to more informed discussions about scope and resources. For a deeper dive into velocity and backlog management, check out this helpful article.
Managing Expectations and Resources
Velocity data is also your best friend for managing stakeholder expectations. When stakeholders ask for features that are beyond the team's capacity, historical data can show what's truly achievable. This helps everyone prioritize features and allocate resources effectively. You might also find this interesting: Engineering Productivity Measurement.
Advanced Forecasting With Velocity
Basic velocity tracking is focused on sprint-level planning. But you can use velocity trends for longer-term forecasting, too. By analyzing historical data and spotting patterns, you can project future velocity and communicate potential uncertainty in a way that builds confidence. This allows for more informed product roadmapping and strategic decision-making.
Communicating Uncertainty Effectively
Forecasting always has some level of uncertainty. Don't try to hide it—embrace it. Communicate potential variations in velocity using ranges or confidence intervals. For example, "Based on our velocity trend, we're 80% confident we can deliver Feature X within the next three sprints." This transparency builds trust and prepares stakeholders for possible adjustments.
By understanding and using these techniques, agile velocity tracking becomes more than just a metric. It becomes a strategic advantage for planning, communication, and continuous improvement. It helps teams make smart choices, manage expectations, and consistently deliver value. This data-driven approach creates a culture of transparency and collaboration, ultimately contributing to project success and a more predictable development process.
Avoiding The Velocity Tracking Trap: Common Mistakes and Real Solutions
Even seasoned agile teams can fall into traps with agile velocity tracking, turning a helpful tool into a major headache. It’s like navigating a winding mountain trail – knowing the common hazards is key to reaching the summit. This section explores the most damaging mistakes and offers practical ways to keep your team on the right path.
The Performance Review Pitfall
Using velocity for individual performance reviews is a recipe for disaster. It completely undermines psychological safety, the foundation of any high-performing team. Imagine being penalized for a slow running pace after spraining your ankle. Similarly, judging developers based on velocity ignores the collaborative nature of agile and makes people afraid to speak up about roadblocks. A much better approach is to focus on overall team performance and create a culture where people feel comfortable asking for help.
The Gaming the System Gambit
When velocity becomes the target, teams start gaming the system. Inflated story point estimates and cutting corners on quality become the norm. This creates a vicious cycle where artificially high velocity leads to unrealistic expectations, and ultimately, project failure. Think of it like a marathon runner cutting the course – they might "win," but it’s a hollow victory. A more effective strategy is to emphasize delivering real value and focus on accurate estimation practices.
The Comparing Apples and Oranges Conundrum
Comparing velocities between teams is like comparing marathon times between runners on different courses. Each team has its own context, unique skill sets, and working agreements. Different estimation scales and varying levels of experience make direct comparisons meaningless. Instead, focus on each team's individual progress and avoid creating unhealthy competition.
Recognizing Toxic Velocity Tracking
There are warning signs when velocity tracking becomes toxic. If your team is spending more time arguing about story points than delivering value, or if the fear of missing velocity targets stifles collaboration, it's time to reassess. Remember, velocity is a tool for the team, not a weapon against them. You might find this helpful: How to measure team productivity.
When Traditional Velocity Doesn’t Fit
Traditional velocity tracking isn’t a one-size-fits-all solution. Teams working on research-heavy projects or those with highly variable tasks might find other measurement strategies more helpful. Consider options like cycle time or throughput to gain a better understanding of your team's performance.
Handling Management Pressure
Sometimes, management might pressure teams to artificially inflate their velocity. This completely defeats the purpose of velocity tracking. Use data and clear communication to explain why arbitrary velocity increases are unsustainable and harmful to the project. Focus on the value delivered and the team's sustainable pace.
Maintaining Integrity Under Pressure
Organizational politics can also skew velocity tracking. It's critical to maintain the integrity of your measurement system. Document any outside factors that influence velocity, like scope changes or resource constraints. This transparency protects the team and ensures velocity remains a reliable indicator of progress, not a political football.
Let's look at some common velocity tracking pitfalls and how to address them:
To help visualize these issues and their solutions, we've put together a table:
Velocity Tracking Pitfalls and Solutions Common Pitfall | Why It Happens | Negative Impact | Better Approach | Success Indicators ---|---|---|---|---| Using Velocity for Performance Reviews | Management misunderstands the purpose of velocity. | Erodes trust and psychological safety, encourages inflated estimates. | Focus on team performance, foster a culture of open communication. | Improved team morale, more accurate estimations. Gaming the System | Pressure to meet unrealistic velocity targets. | Reduced quality, technical debt, burnout. | Emphasize value delivery, accurate estimations. | Higher quality deliverables, more predictable sprints. Comparing Teams | Misguided attempts to benchmark performance. | Creates unhealthy competition, demoralizes teams. | Focus on each team's individual improvement. | Increased team focus, improved individual team velocity trends. Ignoring External Factors | Lack of awareness of factors impacting velocity. | Inaccurate velocity readings, unrealistic expectations. | Document external factors (scope changes, resource constraints). | More accurate velocity data, better sprint planning. Over-Reliance on Velocity | Velocity becomes the sole measure of success. | Neglect of other important metrics (quality, customer satisfaction). | Use a balanced set of metrics. | Improved product quality, increased customer satisfaction.
This table highlights the importance of using velocity as a tool for continuous improvement, rather than a stick for punishment or a source of unhealthy competition.
By avoiding these pitfalls and understanding the true purpose of agile velocity tracking, you can transform it from a potential source of friction into a powerful engine for team success.
Advanced Velocity Analysis For Continuous Improvement
Once you understand the basics of agile velocity tracking, you're ready to uncover deeper insights. Think of a basketball coach analyzing game footage. They're not just looking at the score; they're studying player movements and strategies to find hidden opportunities. Advanced velocity analysis is similar—it helps you identify patterns in your team's workflow that might not be obvious at first glance.
Identifying Velocity Trends and Team Health
Just like a coach spots patterns in a player's performance, you can identify trends in your team's velocity. A consistently decreasing velocity could signal team burnout, process bottlenecks, or unclear requirements. On the other hand, a steadily increasing velocity might suggest improved collaboration or more efficient workflows. Tracking these trends helps you address potential issues early on.
Correlation With Other Metrics
Velocity data shouldn’t exist in a vacuum. Correlating it with other metrics, such as code quality, defect rate, or cycle time, provides a broader view of your team's performance. For example, a sudden velocity increase alongside a jump in defects might mean the team is rushing to meet deadlines. This analysis helps you identify the root causes of performance fluctuations and make targeted improvements. You might find our guide on automated code review tools useful for boosting code quality.
Advanced Forecasting and Confidence Intervals
Basic velocity calculations offer a glimpse of past performance. However, using historical data and considering things like team changes or upcoming holidays, advanced forecasting techniques help project future performance more accurately. Confidence intervals, a range of possible velocity outcomes, acknowledge the unpredictable nature of software development and help set realistic expectations. Instead of promising a fixed delivery date, you can say something like, "We're 90% confident we can deliver Feature X within the next two to three sprints."
Seasonal Adjustments and Capacity Planning
Just as businesses adjust forecasts for seasonal sales changes, development teams should account for their work capacity variations. Things like holidays, team vacations, or training periods can significantly impact velocity. Seasonal adjustments to your velocity calculations keep your forecasts accurate and realistic. This also aids capacity planning, letting you anticipate lower capacity periods and adjust sprint goals accordingly. For example, knowing a key team member will be on vacation lets you plan a lighter sprint or reassign tasks.
Informed Decision-Making on Team Structure
Velocity data can also inform decisions about team structure. If a team consistently misses velocity goals despite process improvements, it might signal a need for more resources or expertise. Conversely, a consistently high velocity could mean an opportunity to redistribute resources to other teams. Using velocity data this way ensures your team structure aligns with project needs.
Optimizing Sprint Planning and Backlog Refinement
High-performing teams use velocity analysis to fine-tune sprint planning and backlog refinement. By understanding their sustainable pace, they can make smarter decisions about how much work to commit to in each sprint. This lowers the risk of over-committing and increases the chance of meeting sprint goals. Velocity data can also inform backlog refinement discussions, helping the team prioritize tasks and break down large stories into smaller, more manageable pieces. This creates a continuous feedback loop between velocity analysis and agile practices, ensuring constant learning and improvement.
Quality-Integrated Velocity: Sustainable Performance Tracking
Imagine you're leading a Formula 1 team. You want the fastest car, sure, but a car that breaks down mid-race is useless. Agile velocity tracking is like measuring your car's speed, but without also checking engine health and tire pressure (quality), you’re setting yourself up for disaster. This integrated approach ensures your definition of "done" truly reflects completed and quality work.
This isn't just about speed, it's about sustainable speed.
Think of building software like building a house. You could quickly throw up walls and a roof, but without solid foundations and proper inspections, it's not going to last.
Pull Checklist helps you build that strong foundation by embedding quality checks directly into your workflow. It acts like a checklist for your house construction, making sure everything from plumbing to electrics is inspected before you move in.
The screenshot above shows Pull Checklist within a GitHub pull request, illustrating how these quality checks are integrated. It's like having a building inspector sign off on every stage of construction.
Weighting Story Points For Quality
How do you account for the time spent on those crucial checks? One practical approach is weighting story points based on quality. A story requiring extensive testing or complex code reviews should have higher story points, reflecting the effort needed for true completion.
This approach acknowledges that quality takes time and resources. It’s like budgeting more time for complex construction phases, such as installing a custom-designed kitchen, compared to simpler tasks, like painting a wall.
Tracking technical debt, alongside velocity, further illuminates long-term sustainability. A rising velocity coupled with increasing technical debt is a warning sign, like driving fast with a flashing check engine light. It signals potential issues down the line that could slow down future progress.
By taking this integrated approach, teams can balance delivering high-quality work now with the long-term health of their project.
Preventing Velocity Inflation with Automated Checks
Automated quality checks, like those provided by Pull Checklist, prevent velocity inflation from cutting corners. It's like having automated systems in place that flag potential construction errors before they become major problems. By enforcing essential tasks within pull requests, Pull Checklist ensures consistent quality. This avoids the illusion of speed gained by rushing through inadequate reviews, preventing future "rebuilds" due to faulty code.
Furthermore, automated checks enhance the feedback loop, enabling teams to identify and address quality issues earlier in the sprint. This prevents rework and keeps the project moving forward efficiently. Think of it as continuous quality monitoring throughout the construction process, rather than waiting for a final inspection to uncover problems. To further improve your agile velocity analysis, consider incorporating techniques like people analytics.
By weaving quality directly into agile velocity tracking, teams cultivate a culture of sustainable performance. This creates a development environment where quality is an integral part of the process, resulting in a consistent delivery pace, improved code quality, and fewer issues impacting future sprints.
Ready to experience the power of sustainable performance? Explore Pull Checklist on the GitHub Marketplace and supercharge your team's agile velocity: https://www.pullchecklist.com