Top Engineering Metrics Examples to Boost Your Team


Unlocking Engineering Excellence with Key Metrics
Engineering teams need clear performance visibility to deliver quality products efficiently. This listicle provides eight essential engineering metrics examples to optimize your team's productivity, code quality, and overall effectiveness. We'll explore real-world use cases and practical implementation tips, offering strategic analysis for each. To achieve engineering excellence, it's crucial to understand and track key performance indicators. For a deeper dive, consider exploring these key DevOps performance metrics. We will delve into metrics such as Mean Time To Repair (MTTR), Code Coverage, Deployment Frequency, and Lead Time for Changes. Additionally, we will cover Change Failure Rate, Technical Debt Ratio, System Uptime/Availability, and Sprint Velocity. This comprehensive list provides actionable insights for improving your engineering processes, offering replicable strategies and behind-the-scenes details to help your team excel. You’ll learn how to effectively implement and leverage these metrics to boost your workflow and achieve better outcomes. We'll also discuss how tools like Pull Checklist can streamline these processes further.
1. Mean Time To Repair (MTTR)
Mean Time To Repair (MTTR) is a crucial engineering metric that measures the average time it takes to repair a failed system or component and restore it to full functionality. This metric encompasses the entire repair process, from initial detection and diagnosis to the actual repair and final testing. MTTR is a key performance indicator (KPI) for operational excellence, directly influencing customer satisfaction and business continuity.

Why MTTR Matters
MTTR provides valuable insights into system reliability and the efficiency of maintenance processes. A lower MTTR generally indicates a more robust system and a more effective response to failures. This translates to reduced downtime, improved customer experience, and minimized revenue loss from service disruptions. Tracking MTTR enables organizations to proactively identify areas for improvement in their incident response workflows.
Examples of Successful MTTR Implementation
- Netflix: Maintains an impressively low MTTR of under 15 minutes for critical streaming services, ensuring minimal disruption to their millions of users. This exemplifies a commitment to rapid recovery and high availability.
- Amazon Web Services (AWS): Targets a sub-hour MTTR for the majority of their service disruptions. Their focus on rapid response and resolution reinforces their reputation for reliability.
- Spotify: Leverages MTTR tracking to optimize their deployment pipeline recovery. This strategic approach demonstrates a focus on continuous improvement and agile development practices.
Actionable Tips for Improving MTTR
- Automate Monitoring: Implement automated monitoring systems to reduce detection time and enable proactive identification of potential issues.
- Develop Runbooks: Create detailed runbooks and escalation procedures to streamline the diagnosis and repair process.
- Track by Severity and Component: Track MTTR by severity level and system component to pinpoint specific areas requiring attention.
- Conduct Post-Incident Reviews: Regularly conduct post-incident reviews to identify opportunities for improvement and prevent recurring issues.
- Invest in Diagnostic Tooling: Equip your teams with tooling that provides quick and efficient diagnostic capabilities.
When and Why to Use MTTR
MTTR is particularly relevant for any organization that relies on complex systems or provides services with high availability requirements. This includes but isn't limited to software companies, cloud providers, e-commerce platforms, and financial institutions. Tracking and optimizing MTTR is essential for:
- Minimizing Downtime: Reducing the impact of system failures on business operations and customer experience.
- Improving Reliability: Identifying and addressing weaknesses in system architecture and maintenance processes.
- Increasing Customer Satisfaction: Ensuring a seamless and uninterrupted service experience.
- Enhancing Operational Efficiency: Streamlining incident response workflows and optimizing resource allocation.
MTTR deserves a prominent place in any list of essential engineering metrics due to its direct impact on business performance and customer satisfaction. By strategically tracking and actively working to reduce MTTR, organizations can build more resilient systems, deliver superior service, and gain a competitive advantage.
2. Code Coverage
Code coverage is a quantitative metric that measures the percentage of source code executed during automated testing. It helps engineering teams assess the thoroughness of their test suites by identifying untested code paths, functions, branches, and statements. Code coverage is essential for maintaining code quality, reducing bugs in production, and ensuring comprehensive testing practices across development teams.

Why Code Coverage Matters
Code coverage provides valuable insights into the effectiveness of testing efforts. Higher coverage suggests a more robust and thoroughly tested codebase, potentially reducing the risk of undetected bugs. Tracking code coverage helps teams prioritize testing efforts and identify areas requiring additional test cases, ultimately leading to improved software quality and reduced maintenance costs.
Examples of Successful Code Coverage Implementation
- Google: Maintains over 85% code coverage across many internal projects, demonstrating a strong commitment to comprehensive testing and high-quality code. This rigorous approach minimizes the likelihood of critical bugs reaching production.
- Airbnb: Requires 80% code coverage for all new feature deployments. This policy ensures a consistent level of testing across the codebase and helps prevent regressions.
- Microsoft: Achieves and maintains greater than 90% code coverage for .NET Core with extensive unit testing. This exemplifies their focus on robust, reliable software development practices.
Actionable Tips for Improving Code Coverage
- Set Realistic Targets: Aim for a practical coverage target (e.g., 70-85%) rather than striving for 100%, which can be impractical and lead to diminishing returns.
- Prioritize Critical Paths: Focus on achieving high coverage for critical business logic and error handling paths.
- Integrate with CI/CD: Implement coverage tracking in your CI/CD pipelines to automatically monitor coverage levels and enforce thresholds for new code changes.
- Use Coverage Reports: Leverage coverage reports to identify gaps in testing and guide code review discussions.
When and Why to Use Code Coverage
Code coverage is valuable for any software development project, especially in environments where code quality and reliability are paramount. Tracking and improving code coverage is essential for:
- Reducing Bugs: Identifying and eliminating untested code paths, thereby minimizing the risk of production defects.
- Improving Code Quality: Promoting more robust and maintainable code through comprehensive testing.
- Enhancing Confidence: Increasing confidence in the software's stability and reliability.
- Supporting Refactoring: Providing a safety net during refactoring efforts by ensuring that changes don't introduce regressions.
Code coverage is an indispensable engineering metric for any organization striving for high-quality software. By strategically tracking and actively working to improve code coverage, teams can deliver more reliable products, reduce development costs, and ultimately enhance customer satisfaction.
3. Deployment Frequency
Deployment frequency measures how often an engineering team successfully releases code changes to production environments. This metric is a key indicator of delivery capability and organizational maturity, reflecting the team's ability to deliver value continuously while maintaining system reliability. It's one of the four key DevOps Research and Assessment (DORA) metrics that correlate strongly with organizational performance.
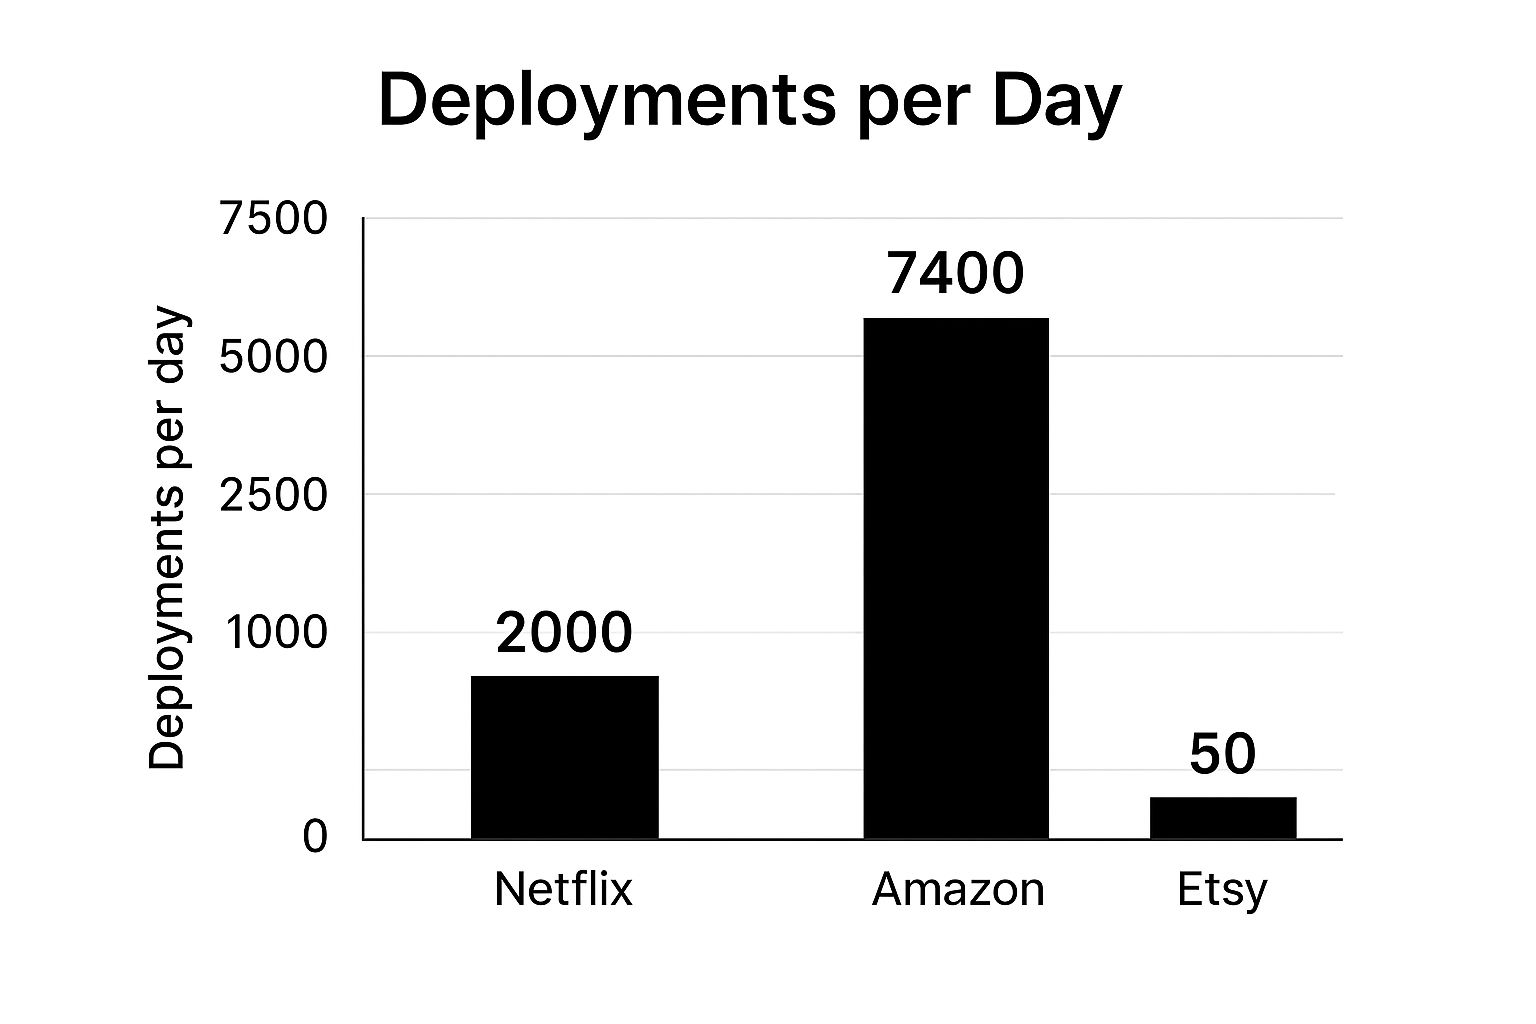
The bar chart above visualizes the deployments per day for Netflix, Amazon, and Etsy, highlighting the vast differences in deployment capabilities. As the chart clearly shows, Amazon boasts a significantly higher deployment frequency compared to Netflix and Etsy, demonstrating a mature and highly automated deployment pipeline.
Why Deployment Frequency Matters
High deployment frequency enables faster feedback loops, quicker time to market for new features, and improved responsiveness to customer needs. It also allows for smaller, less risky deployments, making it easier to identify and resolve issues. Tracking deployment frequency allows organizations to monitor their progress towards continuous delivery and identify bottlenecks in their development processes.
Examples of Successful Deployment Frequency Implementation
- Netflix: Deploys thousands of times per day across their microservices architecture, demonstrating a highly automated and resilient deployment pipeline. This enables them to rapidly iterate on features and provide a seamless streaming experience.
- Amazon: Deploys code every 11.7 seconds on average, showcasing a truly remarkable level of automation and engineering maturity. This allows them to maintain their competitive edge and rapidly scale their services.
- Etsy: Increased deployment frequency from twice per week to 50 times per day through a focused effort on improving their CI/CD pipeline. This demonstrates how even established organizations can significantly improve their delivery capabilities.
Actionable Tips for Improving Deployment Frequency
- Start by Measuring: Establish a baseline for your current deployment frequency to track progress and identify areas for improvement.
- Automate Everything: Invest in automated testing and deployment pipelines to reduce manual effort and accelerate the release process. Learn more about deployment frequency and CI/CD pipeline best practices here.
- Feature Flags: Implement feature flags to decouple deployment from release, allowing you to deploy code more frequently without exposing unfinished features to users.
- Smaller Batch Sizes: Focus on reducing deployment batch size and complexity to minimize risk and improve the speed of rollback in case of issues.
- Track Trends: Monitor trends over time rather than focusing solely on absolute numbers to gain a better understanding of your progress and identify long-term patterns.
When and Why to Use Deployment Frequency
Deployment frequency is a crucial metric for any organization developing and deploying software, especially those adopting agile methodologies and striving for continuous delivery. Tracking and optimizing this metric is essential for:
- Accelerating Delivery: Reducing the time it takes to get new features and updates into the hands of users.
- Improving Quality: Enabling smaller, more manageable deployments, leading to easier identification and resolution of bugs.
- Increasing Agility: Responding more effectively to changing market demands and customer feedback.
- Boosting Innovation: Creating a culture of continuous improvement and experimentation.
Deployment frequency is a cornerstone of modern software development, directly impacting an organization's ability to innovate and compete. By prioritizing this metric and implementing the strategies outlined above, engineering teams can unlock significant improvements in their delivery capabilities and achieve true continuous delivery.
4. Lead Time for Changes
Lead Time for Changes measures the time elapsed from when a code change is committed to version control until it's successfully running in production. This metric captures the efficiency of the entire software delivery pipeline, encompassing development, testing, approval, and deployment processes. It's a critical indicator of a team's agility and responsiveness to customer needs and market demands. A shorter lead time signifies a more streamlined and efficient development process.
Why Lead Time for Changes Matters
Lead Time for Changes provides crucial insights into an organization's development velocity and ability to deliver value quickly. A shorter lead time translates to faster feedback loops, quicker iterations, and improved time to market for new features and bug fixes. This enhanced agility enables organizations to stay ahead of the competition and respond effectively to evolving customer needs. Tracking lead time also helps identify bottlenecks in the delivery pipeline.
Examples of Successful Lead Time for Changes Implementation
- Google: Known for its rapid release cycles, Google achieves remarkably low lead times, often measured in hours or days for most changes. This speed is a testament to their highly automated and optimized development processes.
- Nordstrom: Through a dedicated DevOps transformation, Nordstrom dramatically reduced their lead time for changes from months to mere minutes. This radical improvement highlights the potential for significant gains through process optimization and automation.
- ING Bank: By implementing automated pipelines and streamlining their development workflows, ING Bank achieved a remarkable reduction in lead time, shrinking it from weeks to just a few hours. This increased agility enabled them to deliver value to customers much faster.
- Capital One: Leveraging containerization and automation, Capital One achieved a 50% reduction in their lead time for changes. This improvement demonstrates the power of modern technologies in optimizing the software delivery lifecycle.
Actionable Tips for Improving Lead Time for Changes
- Implement Automated CI/CD Pipelines: Automate the build, test, and deployment processes to minimize manual handoffs and reduce the risk of human error.
- Use Small Batch Sizes and Frequent Commits: Smaller changes are easier to test and deploy, leading to faster feedback and quicker iteration cycles.
- Identify and Eliminate Wait Times: Analyze your development pipeline for bottlenecks and delays, and implement strategies to streamline the flow of work.
- Invest in Automated Testing: Automating testing processes reduces the time required for manual reviews and approvals, significantly accelerating the delivery pipeline.
- Track Lead Time by Change Type: Identify patterns and areas for improvement by tracking lead time based on the type of change (e.g., feature, bug fix, infrastructure).
When and Why to Use Lead Time for Changes
Lead Time for Changes is a crucial metric for any organization developing and deploying software. It's especially relevant for companies operating in fast-paced environments or those practicing agile development methodologies. Tracking and optimizing lead time is essential for:
- Accelerating Time to Market: Delivering new features and updates to customers faster, gaining a competitive edge.
- Improving Development Velocity: Increasing the speed and efficiency of the entire software development lifecycle.
- Enhancing Responsiveness: Quickly adapting to changing market conditions and customer needs.
- Reducing Risk: Minimizing the impact of errors by deploying smaller changes more frequently.
Lead Time for Changes is a vital engineering metric that directly influences an organization's ability to deliver value rapidly and respond effectively to market demands. By actively tracking and consistently working to reduce lead time, organizations can achieve greater agility, accelerate innovation, and ultimately deliver a superior customer experience.
5. Change Failure Rate
Change failure rate measures the percentage of production deployments that result in degraded service, service outages, or require immediate remediation such as hotfixes, rollbacks, or patches. This metric balances speed of delivery with quality and stability. It helps teams understand the reliability of their deployment processes and the effectiveness of their testing strategies. A lower change failure rate contributes significantly to a positive user experience and operational efficiency.
Why Change Failure Rate Matters
Tracking change failure rate provides essential insights into the health of the software development lifecycle. A high failure rate can indicate deficiencies in testing practices, inadequate automation, or insufficient pre-deployment validation. Conversely, a consistently low rate signals robust processes, effective testing, and ultimately, higher quality software releases. This leads to improved customer satisfaction, reduced operational costs, and increased confidence in the engineering team’s ability to deliver value reliably.
Examples of Successful Change Failure Rate Implementation
- Amazon: Maintains a remarkably low change failure rate below 0.1% through rigorous automated testing and continuous integration/continuous deployment (CI/CD) pipelines. This exemplifies the power of automation in ensuring deployment reliability.
- Netflix: Keeps their failure rate under 1% despite thousands of daily deployments by leveraging sophisticated canary deployments and a culture of proactive monitoring. This demonstrates how speed and stability can coexist with the right strategies.
- Microsoft: Reduced change failure rate by 60% by implementing improved testing practices and rigorous code reviews. This highlights the importance of quality control throughout the development process.
- Shopify: Maintains a change failure rate below 2% even during peak shopping seasons through meticulous planning, robust infrastructure, and effective incident response procedures. This underlines the significance of preparedness and resilience.
Actionable Tips for Improving Change Failure Rate
- Clearly Define Failure: Establish a precise definition of what constitutes a deployment failure. This ensures consistent measurement and analysis.
- Automate Testing: Implement comprehensive automated testing at multiple levels, including unit, integration, and end-to-end tests.
- Canary Deployments: Use canary deployments and feature flags to reduce the blast radius of potential failures.
- Post-Incident Reviews: Conduct thorough post-incident reviews to identify root causes and prevent recurring failures.
- Balance with Frequency: Optimize the balance between failure rate and deployment frequency for optimal performance.
When and Why to Use Change Failure Rate
Change failure rate is an essential engineering metric for any organization that frequently deploys software, particularly those operating in cloud environments or providing online services. Tracking this metric is crucial for:
- Improving Deployment Reliability: Identifying and addressing weaknesses in the deployment pipeline.
- Minimizing Service Disruptions: Reducing the frequency and impact of deployment-related outages.
- Enhancing Customer Experience: Ensuring a consistent and reliable user experience.
- Accelerating Delivery Speed: Building confidence in the deployment process to enable faster and more frequent releases.
Change failure rate is a key indicator of engineering excellence. By diligently tracking and actively working to reduce this metric, organizations can enhance their software delivery capabilities, improve system stability, and build a stronger foundation for future growth. It is a vital component of any robust set of engineering metrics examples.
6. Technical Debt Ratio
Technical Debt Ratio (TDR) quantifies the cost of addressing code quality issues as a percentage of the total development effort. It's a crucial engineering metric for understanding the long-term maintainability of a codebase and making informed decisions about prioritizing refactoring versus new feature development. TDR typically combines static code analysis results with estimated remediation effort, providing a tangible measure of technical debt. This allows teams to balance the need for rapid development with the importance of maintaining a healthy and sustainable codebase.
Why Technical Debt Ratio Matters
TDR provides valuable insights into the overall health of a software project. A high TDR can indicate a growing backlog of technical debt, which can lead to decreased development velocity, increased bug rates, and difficulty implementing new features. Tracking TDR helps teams proactively manage technical debt, preventing it from becoming an insurmountable obstacle. By understanding the cost of addressing technical debt, organizations can make informed decisions about resource allocation and prioritize remediation efforts effectively. Learn more about managing technical debt with this expert guide for engineering teams.
Examples of Successful Technical Debt Ratio Implementation
- Spotify: Maintains a TDR below 5% through continuous refactoring, demonstrating a commitment to code quality and maintainability. This proactive approach enables them to maintain a high development velocity and rapidly deploy new features.
- LinkedIn: Reduced their TDR by 40% through dedicated cleanup sprints. This focused effort significantly improved code quality and reduced long-term maintenance costs.
- Atlassian: Tracks TDR as part of their core engineering health metrics, showcasing the importance they place on managing technical debt. This ensures they address potential issues early, preventing them from impacting product development.
Actionable Tips for Improving Technical Debt Ratio
- Use Consistent Tooling: Implement standardized static analysis tools and measurement criteria across projects to ensure consistent tracking and reporting.
- Set Realistic Targets: Establish achievable TDR targets based on project context and track trends over time, rather than focusing solely on absolute values.
- Integrate into Workflows: Incorporate debt measurement into regular development workflows, such as code reviews and pull requests, to address issues proactively.
- Allocate Dedicated Time: Dedicate specific sprints or time slots for technical debt reduction to ensure consistent progress.
- Prioritize High-Impact Debt: Focus on addressing technical debt that directly affects development velocity and product quality.
When and Why to Use Technical Debt Ratio
TDR is particularly relevant for any software development team working on long-lived projects. It's essential for:
- Maintaining Velocity: Preventing technical debt from slowing down development speed.
- Improving Code Quality: Proactively addressing code issues and improving maintainability.
- Reducing Risk: Minimizing the likelihood of bugs and security vulnerabilities.
- Improving Predictability: Enabling more accurate estimation and planning for future development efforts.
Technical Debt Ratio deserves a place in any list of essential engineering metrics because it provides a quantifiable measure of code quality and maintainability. By actively tracking and managing TDR, organizations can build more sustainable software, reduce long-term costs, and maintain a high level of development velocity.
7. System Uptime/Availability
System uptime/availability measures the percentage of time a system or service is operational and accessible to users over a specific period. Typically expressed in "nines" (99.9%, 99.99%, etc.), this metric is fundamental to understanding system reliability and meeting service level agreements (SLAs). It directly impacts user experience, revenue, and business reputation, making it a critical engineering metric example.
Why System Uptime/Availability Matters
High availability ensures users can access services when needed, fostering trust and satisfaction. Downtime, conversely, leads to lost productivity, revenue loss, and potential damage to brand reputation. Tracking availability allows organizations to identify weaknesses in their infrastructure and implement improvements to enhance reliability and resilience.
Examples of Successful System Uptime/Availability Implementation
- AWS: Guarantees 99.99% availability for most services, backed by SLA credits, demonstrating their commitment to providing reliable services. This high availability attracts businesses reliant on dependable cloud infrastructure.
- Google Cloud Platform: Maintains 99.95% availability across global regions, leveraging redundant infrastructure and sophisticated traffic management. This global reach with high availability supports businesses with international user bases.
- Cloudflare: Achieves 99.99%+ uptime through its global edge network architecture, distributing traffic and mitigating the impact of localized outages. This architecture provides a highly resilient and available platform for websites and applications.
Actionable Tips for Improving System Uptime/Availability
- Define Availability: Establish clear and consistent criteria for measuring availability to avoid ambiguity and ensure accurate tracking.
- Implement Redundancy: Utilize redundant systems and failover mechanisms to minimize the impact of hardware or software failures.
- User-Perspective Monitoring: Monitor availability from the user's perspective, not just internal systems, to capture the real user experience.
- Include Planned Maintenance: Factor planned maintenance into availability calculations for transparency and accurate representation of overall uptime.
- Trend Analysis: Analyze availability trends to identify recurring issues, predict potential problems, and guide infrastructure investment priorities.
When and Why to Use System Uptime/Availability
System uptime/availability is relevant for any organization providing online services or relying on critical systems for operations. This includes software-as-a-service (SaaS) providers, e-commerce platforms, financial institutions, and healthcare organizations. Tracking and optimizing availability is essential for:
- Meeting SLAs: Ensuring contractual obligations regarding service availability are met.
- Maintaining User Trust: Providing a consistently available service fosters user confidence and loyalty.
- Protecting Revenue: Minimizing downtime reduces revenue loss and prevents business disruption.
- Enhancing Business Reputation: High availability contributes to a positive brand image and strengthens market competitiveness.
System uptime/availability deserves a prominent place in any engineering metrics examples list due to its direct link to business success and customer satisfaction. By prioritizing and actively managing system uptime, organizations demonstrate their commitment to providing reliable and dependable services.
8. Sprint Velocity
Sprint Velocity measures the amount of work a development team completes during a sprint. This is typically measured in story points, hours, or other estimation units. This metric helps teams understand their delivery capacity and improve predictability in project planning. Velocity is most valuable when tracked over multiple sprints to identify trends and support realistic commitment planning for future work.
Why Sprint Velocity Matters
Sprint Velocity provides crucial insights into a team's consistent delivery pace. It's not about pushing teams to work faster, but about understanding their sustainable output. This allows for more accurate project forecasting and reduces the likelihood of overcommitment or missed deadlines. By understanding their velocity, teams can make more informed decisions about how much work they can realistically take on in future sprints. Learn more about Sprint Velocity at this resource on engineering productivity measurement.
Examples of Successful Sprint Velocity Implementation
- Spotify: Tracks velocity trends across hundreds of autonomous squads to understand capacity variations and inform resource allocation. This decentralized approach enables data-driven decisions at the team level.
- Atlassian: Their Jira software provides built-in velocity tracking and forecasting tools, streamlining the process for teams and facilitating data-driven sprint planning. This integration makes velocity tracking an integral part of the development workflow.
- ING Bank: Uses velocity metrics to optimize team composition and workload distribution. They leverage the data to identify potential bottlenecks and ensure balanced team performance.
Actionable Tips for Improving Sprint Velocity Tracking
- Track Trends: Track velocity trends over at least 6-8 sprints for meaningful insights. Avoid reacting to short-term fluctuations.
- Focus on Consistency: Prioritize consistent velocity over maximizing output in any single sprint. Predictability is key.
- Adjust for Change: Adjust velocity expectations when team composition or project scope changes.
- Balance with Quality: Consider velocity alongside quality metrics. High velocity with low quality is unsustainable.
When and Why to Use Sprint Velocity
Sprint Velocity is particularly relevant for agile development teams working in sprints. It's essential for:
- Predictable Planning: Accurately forecasting project timelines and managing expectations.
- Sustainable Pace: Understanding team capacity and avoiding burnout.
- Continuous Improvement: Identifying bottlenecks and optimizing workflows.
Sprint Velocity earns its place among essential engineering metrics because it drives predictable planning and supports sustainable development practices. By tracking and understanding their velocity, teams can deliver value consistently and improve their overall performance.
Engineering Metrics Comparison Table
| Metric | Implementation Complexity 🔄 | Resource Requirements 💡 | Expected Outcomes 📊 | Ideal Use Cases 💡 | Key Advantages ⭐ | |-------------------------|-------------------------------------|------------------------------------------------|---------------------------------------------------|------------------------------------------------------|-------------------------------------------------| | Mean Time To Repair (MTTR) | Moderate - requires accurate time tracking and incident categorization | Monitoring tools, incident management integration | Reduced downtime, improved repair efficiency | Operations, system reliability, SLA compliance | Direct tie to customer satisfaction and operational excellence | | Code Coverage | Moderate - integration with CI/CD and test frameworks required | Automated testing infrastructure, coverage tools | Higher code quality, identification of untested code | Software development, quality assurance | Objective code quality metric, supports regulatory compliance | | Deployment Frequency | High - needs mature CI/CD pipelines and automated deployments | Automated deployment pipelines, feature flag systems | Faster delivery, increased release agility | Continuous delivery teams, DevOps | Enables faster time-to-market and smaller risk deployments | | Lead Time for Changes | High - full pipeline automation and measurement across stages | CI/CD tooling, automated testing | Faster response to market, improved pipeline efficiency | Software delivery process improvement, DevOps | Identifies bottlenecks and improves delivery predictability | | Change Failure Rate | Moderate - requires detailed deployment and failure tracking | Automated testing, monitoring and alerting systems | Balanced delivery speed with stability | Quality assurance, risk management | Objective measure of deployment quality and risk | | Technical Debt Ratio | Moderate - requires consistent static code analysis tools | Static analysis tools, refactoring effort tracking | Improved maintainability and long-term quality | Codebase health monitoring, technical debt management | Justifies refactoring and prioritizes code quality efforts | | System Uptime/Availability | Low to Moderate - relies on monitoring and alerting | Monitoring solutions, redundancy infrastructure | High reliability, SLA adherence | Service reliability, SLA management | Clear metric for stakeholders and guides infrastructure decisions | | Sprint Velocity | Low - based on existing sprint tracking and estimation methods | Agile project management tools | Improved sprint planning and team capacity forecasting | Agile development planning and team performance tracking | Enables realistic planning and trend analysis |
Elevate Your Engineering Performance: Metrics That Matter
This article explored a range of crucial engineering metrics examples, from MTTR and code coverage to sprint velocity and system uptime. We delved into each metric, examining its significance and providing actionable strategies for implementation and analysis. The goal was to equip you with the tools to not just measure, but to truly understand and improve your engineering processes. Remember, these metrics aren't just numbers; they're powerful indicators of your team's health, efficiency, and overall performance.
Key Takeaways and Actionable Insights
Let's recap some of the most important takeaways:
- Prioritize Actionable Metrics: Focus on metrics that directly relate to your business goals and offer clear paths for improvement. For example, tracking deployment frequency without analyzing the change failure rate offers an incomplete picture.
- Context is King: The same metric can have drastically different interpretations depending on the context. A high MTTR for a critical system is a serious concern, while a high MTTR for a low-priority system might be acceptable. Understanding your specific context is paramount.
- Data-Driven Decisions: Don't just collect data; use it to make informed decisions. Analyze trends, identify bottlenecks, and experiment with different approaches to optimize your workflows. Metrics provide the evidence you need to justify changes and demonstrate their impact.
- Continuous Improvement: Implementing these metrics isn't a one-time task; it's an ongoing process of continuous improvement. Regularly review your metrics, refine your approach, and adapt to evolving business needs.
The Power of Engineering Metrics
Mastering these engineering metrics examples is crucial for several reasons:
- Enhanced Performance: By identifying areas for improvement, you can optimize processes, reduce waste, and increase efficiency. This translates to faster development cycles, higher quality software, and improved customer satisfaction.
- Improved Collaboration: Shared metrics foster transparency and accountability within engineering teams. They provide a common language for discussing performance and identifying areas for collaborative improvement.
- Strategic Decision-Making: Data-driven insights empower you to make informed decisions about resource allocation, prioritization, and future development strategies. This enables you to align your engineering efforts with broader business objectives.
In the dynamic world of software development, staying ahead of the curve is essential. By leveraging these engineering metrics examples and incorporating them into your workflow, you can build a high-performing engineering organization that consistently delivers exceptional results.
Optimize your code review process and further enhance your ability to track and improve key engineering metrics. Streamline your workflow and boost code quality with Pull Checklist, a powerful tool designed to help engineering teams manage and analyze their code review process more effectively. Pull Checklist integrates seamlessly with your existing workflow, providing valuable insights that can complement your engineering metrics and drive continuous improvement.